Statistics
Because batch predictions are point-in-time pQuery runs, you'll need to verify that your pQueries are performing as expected by review your batch prediction statistics.
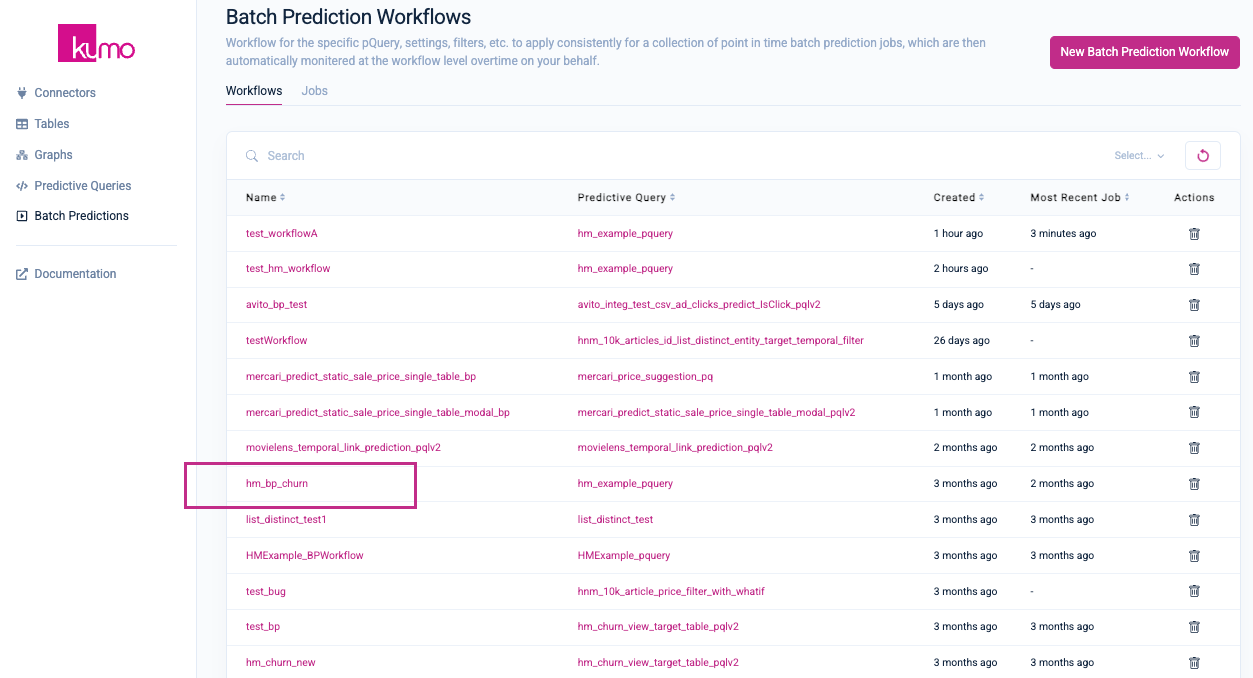
On the "Batch Prediction Workflows" page, click on the batch prediction workflow name under the "Name" column to view its detail page.
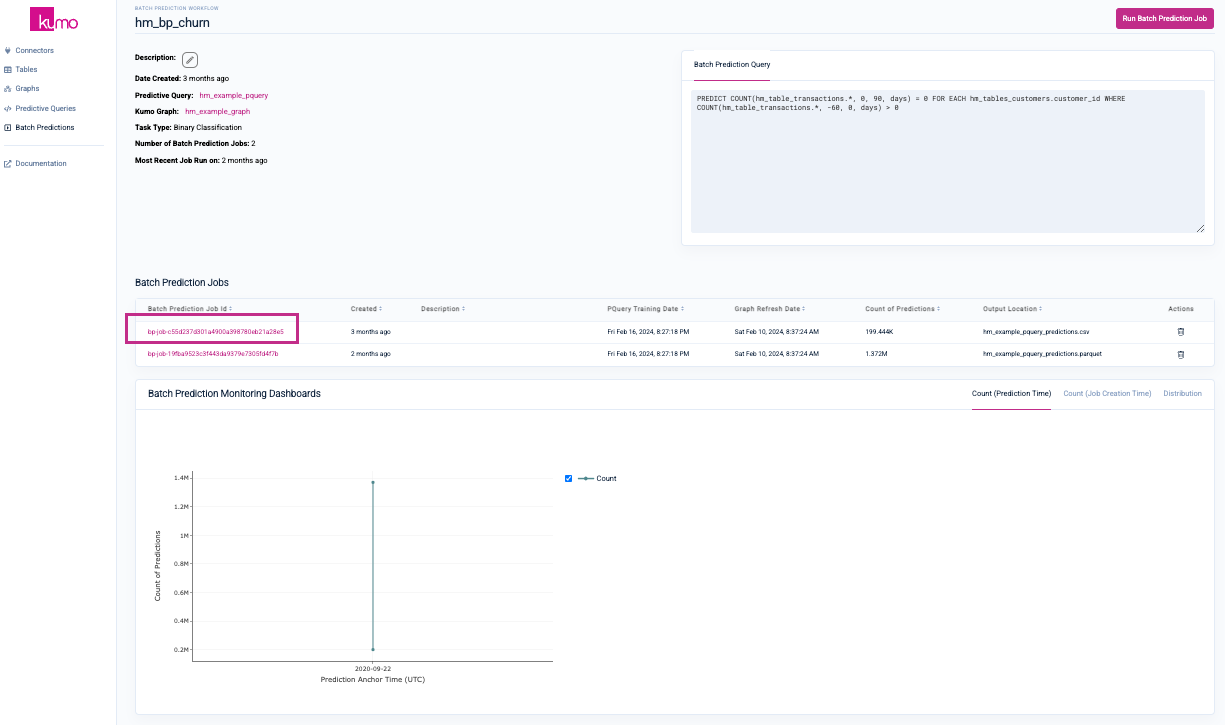
On the batch prediction workflow's detail page, click on a previous batch prediction job to view its details.
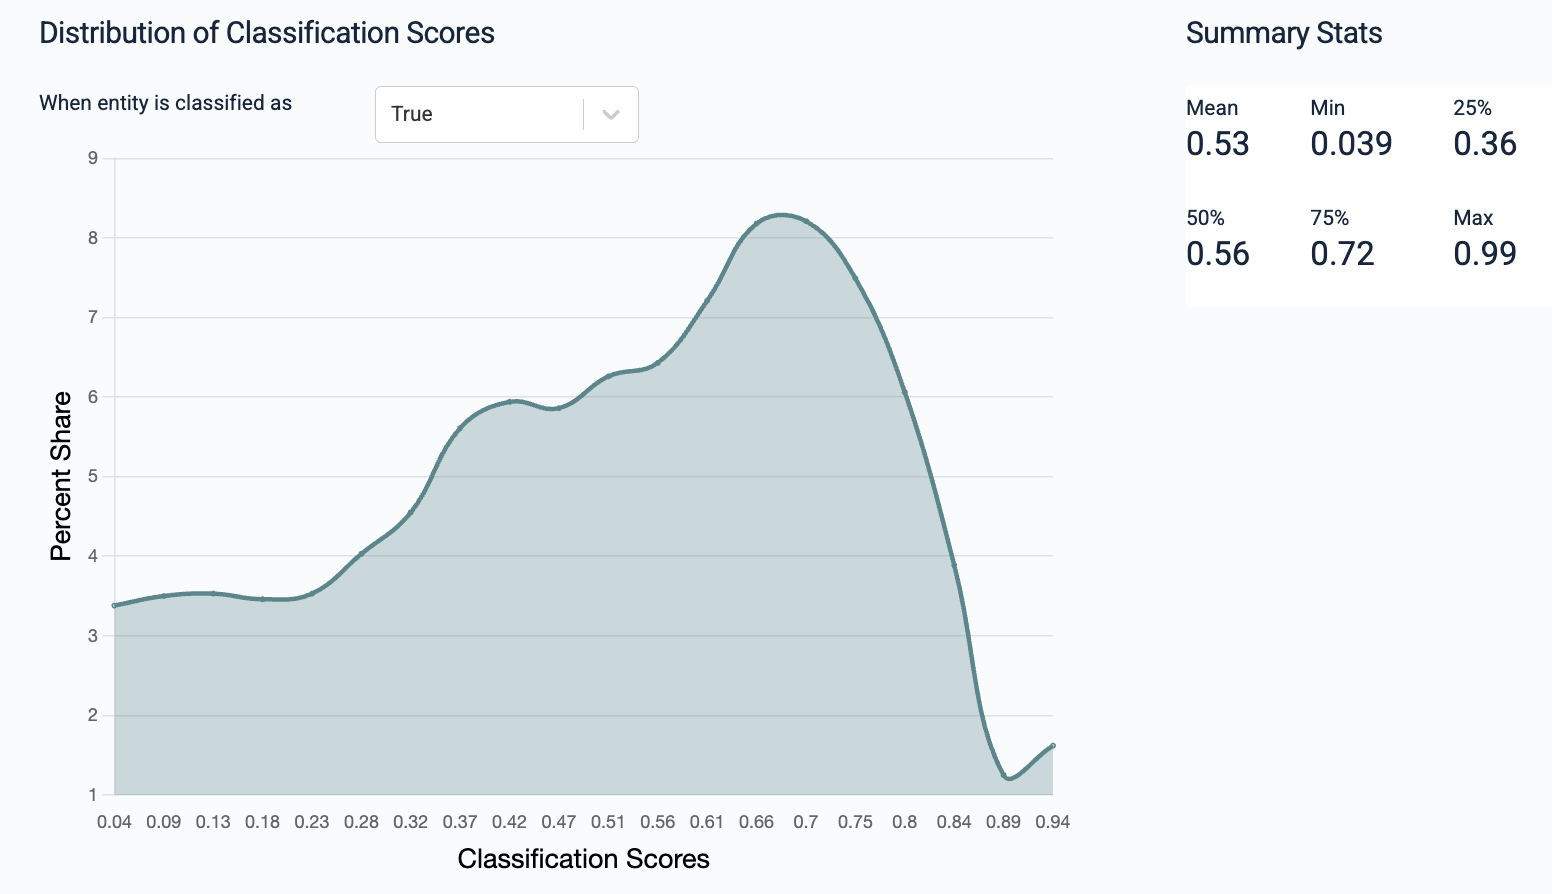
You will be presented with output statistics computed from a sample of table data based on your prediction task type (e.g., regression, binary classification, multi-class classification, multi-label classification, link prediction).
For example, the following are the batch prediction output statistics for a binary classification task:
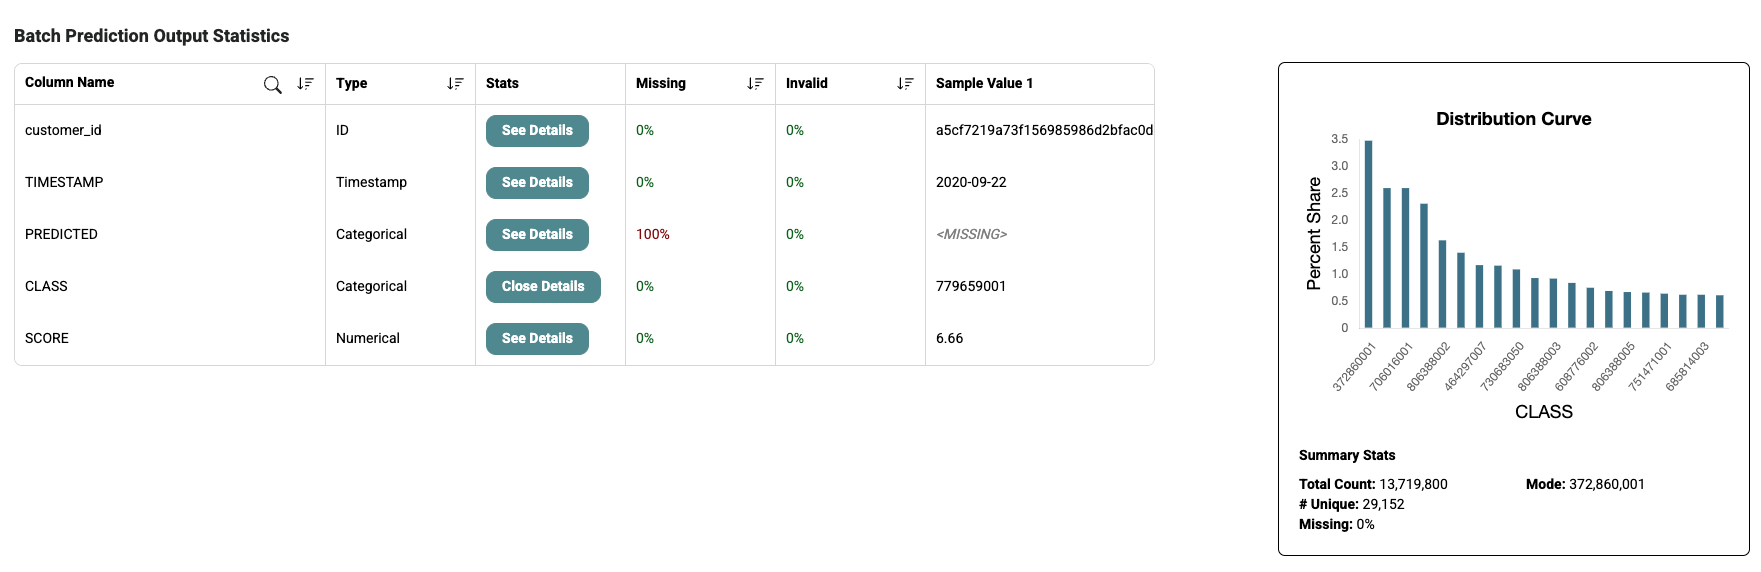
In the case of a link prediction task, a "CLASS" and "SCORE" column can also be viewed from the Batch Prediction Output Statistics:
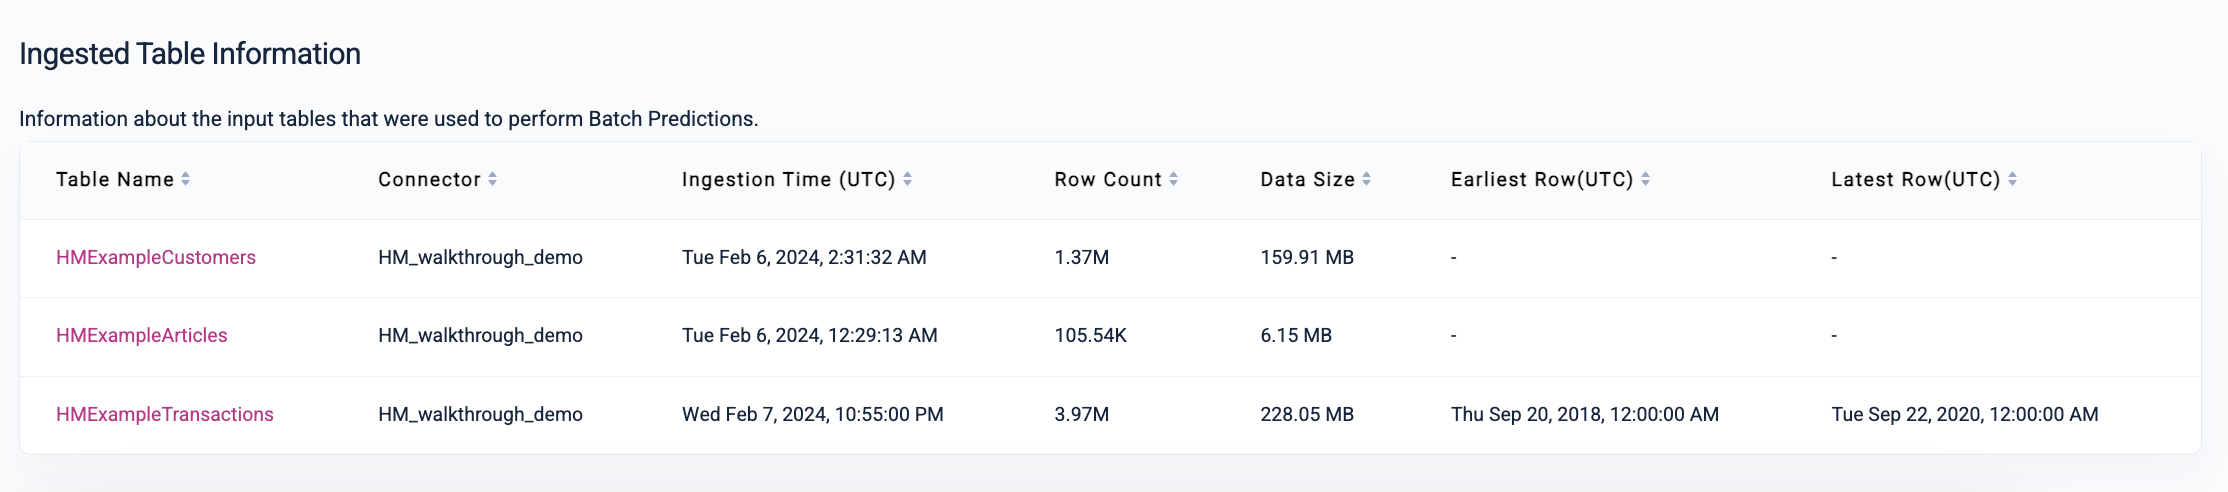
You can also view information about the tables ingested and used to perform your batch predictions:
Data Distribution Drift Statistics
The job details for each of your batch predictions also displays data distribution drift statistics—these metrics are crucial for detecting unexpected changes in the data used to generate your batch predictions.
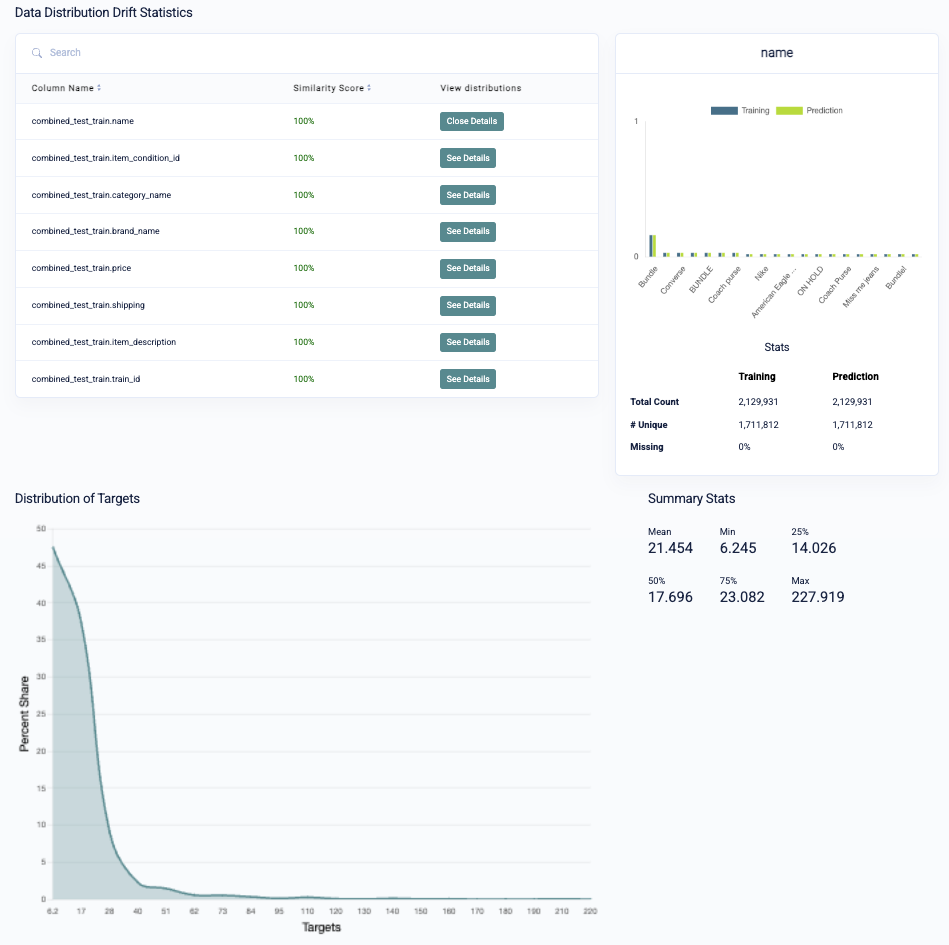
If an upstream pipeline silently fails and changes your data, Kumo will detect this and show you a similarity score based on the Population Stability Index. If you see a column with a low similarity score, you can inspect the distributions to quickly find the root cause of the data drift.
Platt Calibration of Classification Tasks
Kumo calibrates the batch prediction outputs for all classification tasks using the Platt Scaling method to ensure the prediction scores match with their actual probabilities of being true.
Updated 3 months ago