Column Analysis
Note: Column analysis is currently supported for numerical and categorical columns.
Contribution Score
Kumo scores the overall importance of both whole tables as well as individual columns within each table to the final prediction. To enable the analysis of each table columns' effect on the overall prediction, Kumo provides the variation of predictions of all columns across all your Kumo tables.
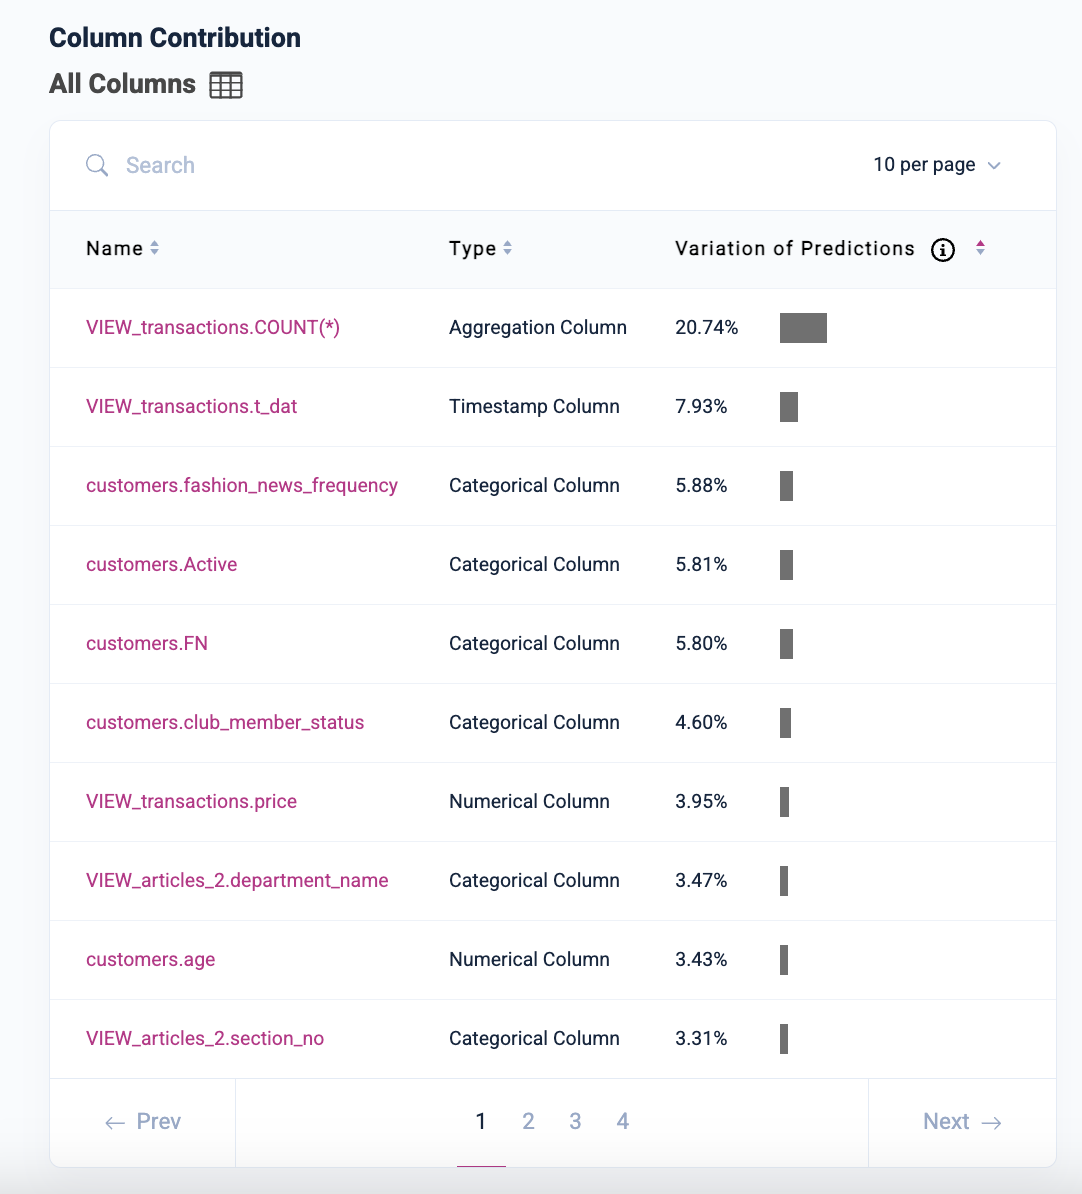
The percentages in the Variation of Predictions column indicate how each respective column contributes to your end predictions, calculated based on the variance of these predictions relative to the underlying columns (i.e., based on both ground truth labels and predictions).
Detecting Data Leakage
Columns with variation of prediction values dramatically higher than any others may be symptoms of data leakage, a common cause of poor accuracy at prediction time. Data leakage occurs during training when the model has access to information directly correlated to the target value being predicted, but not actually known yet at the time of prediction.
For example, if you are predicting whether a customer will churn in the next 30 days and you have a column indicating whether the customer will cancel their subscription in the next 30 days, this would constitute both target leakage and future information leakage; in this case, you would look for an excessively high contribution score for this column.
Analyzing Individual Columns
If you click on an individual column, you can view a plot that displays that the average model prediction against the actual labels in the holdout data split for different entity populations, segmented based on how often their historic rows appear within certain past time intervals.
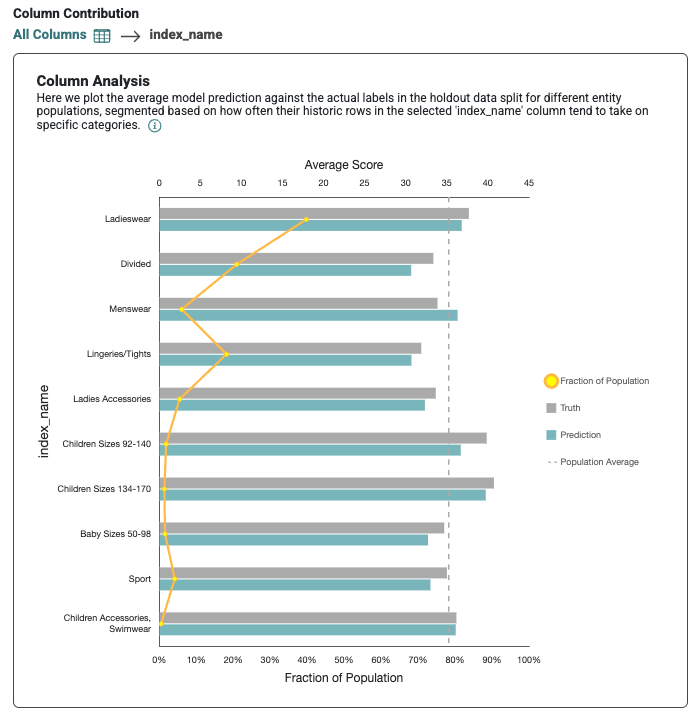
Column analysis can be incredibly useful for troubleshooting why your predictive query is underperforming for a particular subset of data, as well as discovering bias and areas where you might need to shore up your datasets. By analyzing these charts, you can better understand how individual values within each column positively or negatively affect the final prediction distribution. These statistics are calculated using the ground truth (i.e., the target labels)—which is what your predictive query learns from—as well as the actual predicted values.
Column analysis is currently supported for numerical and categorical columns.
Additional Resources
Updated 2 months ago