Graph Creation
Connect your Kumo tables to graphs for making accurate predictions.
Graph Setup
After connecting your tables, the next step is to link them to graphs that enable you to make predictions. This process is crucial, as the linkages defined here enable Kumo to derive the necessary input signals for making accurate predictions.
You can access the "Graph Setup" page by clicking the Create Graphbutton.
On the "Graph Setup"page, provide a Name and optional Description for your graph. Select the tables to add to your new Kumo graph, and click on the Next button to continue.
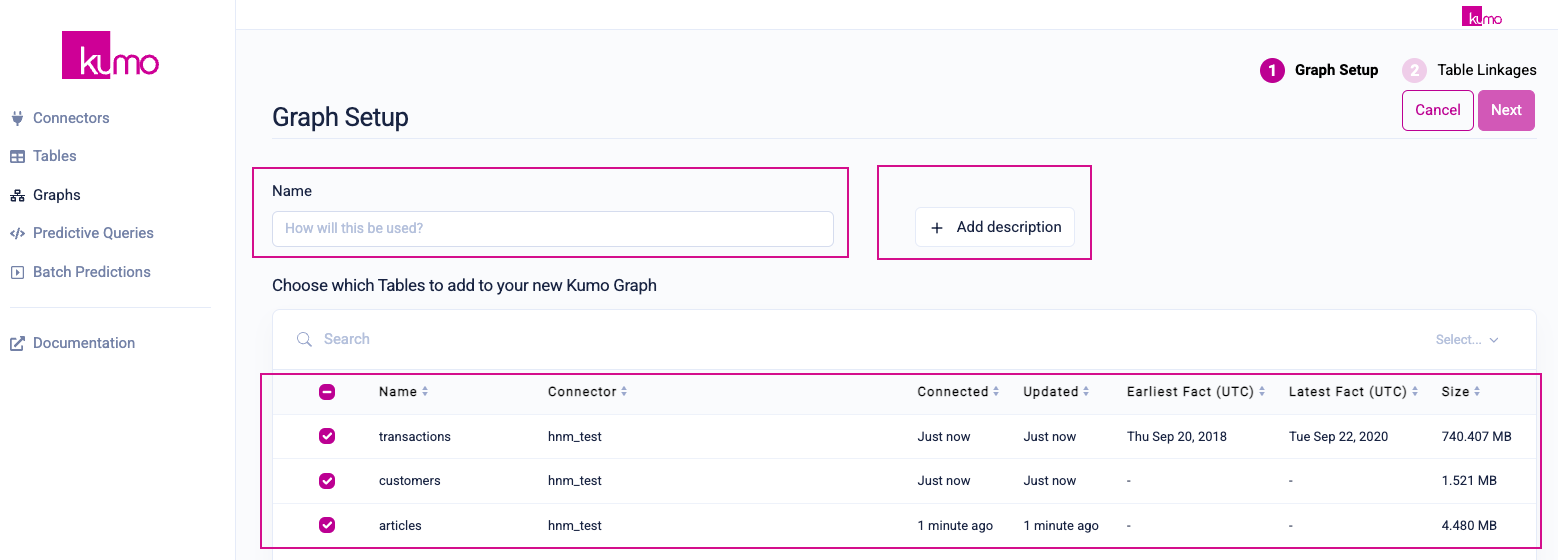
Table Linkages
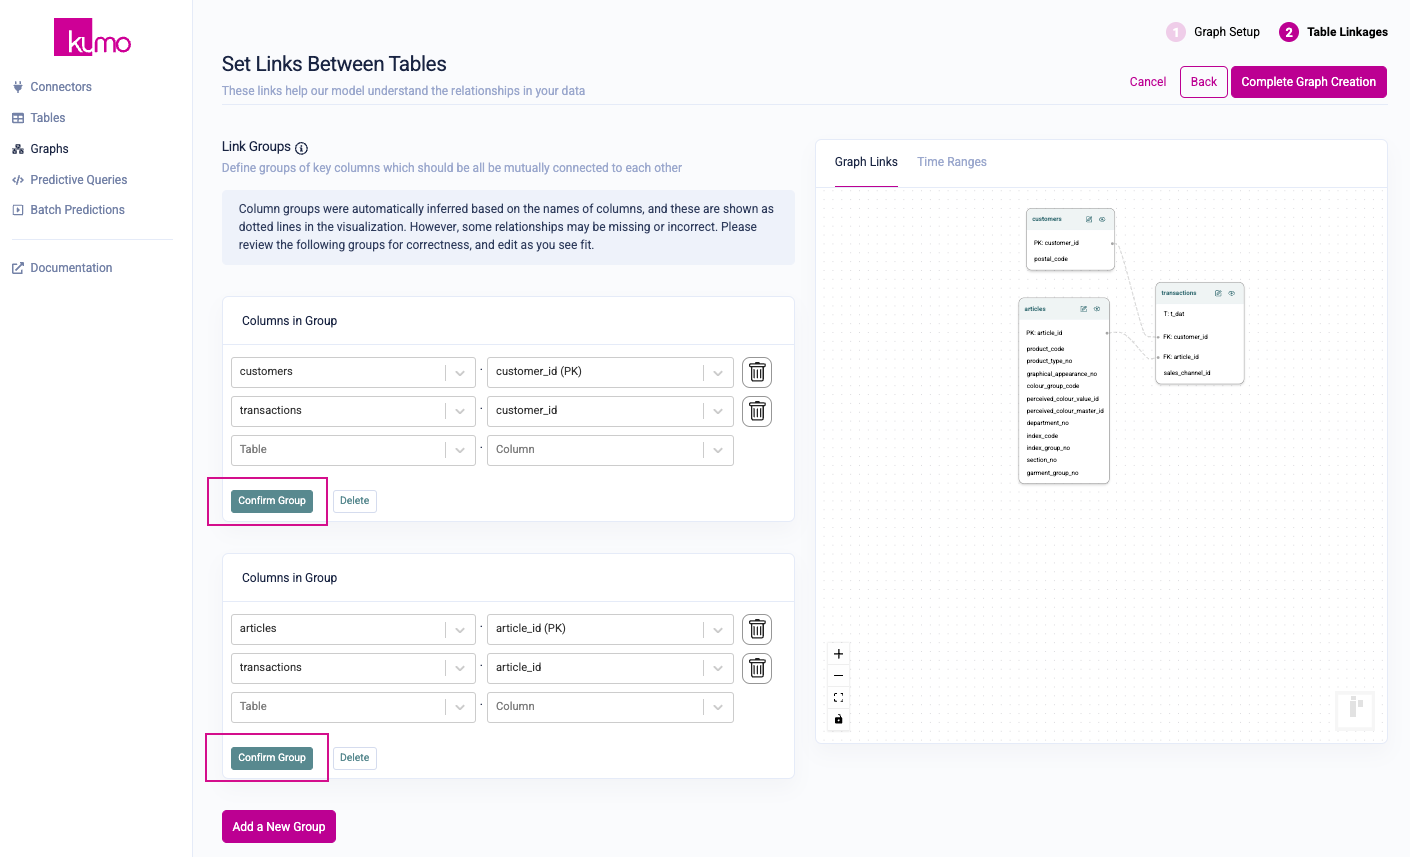
Next, link your tables by selecting groups of key (id) columns that refer to the same underlying entity. This helps Kumo better understand the relationships in your data.
Kumo will group your columns automatically—however, you'll need to review the suggested column groups for correctness and click the Confirm Group button for each column group before proceeding.
For example, the following groupings would apply to an e-commerce example:
- The Shopper ID columns in the shoppers table, sessions table, and every event table should be in the same group.
- The Session ID columns in the sessions table, and every event table should be in the same group.
- The Product ID columns in the products table, and every event table should be in the same group.
Within each group of key columns, exactly one of the Key columns in each group should be the primary key of a dimension table. For example for the "Shopper ID" group above, only the ID in the shoppers table is a primary key, while the others are not (since they are non-unique and come from fact tables). If you have an entity relationship graph where multiple tables have the same primary key, for example if "shopper_info" table and "shopper_addresses" table have "Shopper ID" as the primary key, please join them into a single table before importing to Kumo. This will ensure that each group of key columns strictly have one primary key column.
Column Groups
Kumo automatically suggests linkages once you choose the tables you want to use to create a graph. The column groups are inferred by doing an exact match on the column names across different tables, and are depicted as dotted lines in the graph visualization.
Table Linkage Considerations
When creating table linkages, keep in mind that:
- Kumo automatically detects timestamp-based columnar values—you do not need to link timestamp columns.
- If two linked columns are of different types, both will be automatically cast to a string type; be sure to verify that, after casting, the string-based values between different columns have an exact match as intended.
- Rows with missing key values will be ignored from the graph linkages are created based on that key column.
- Rows with key values that do not link up in an exact match with another table as intended will be ignored.
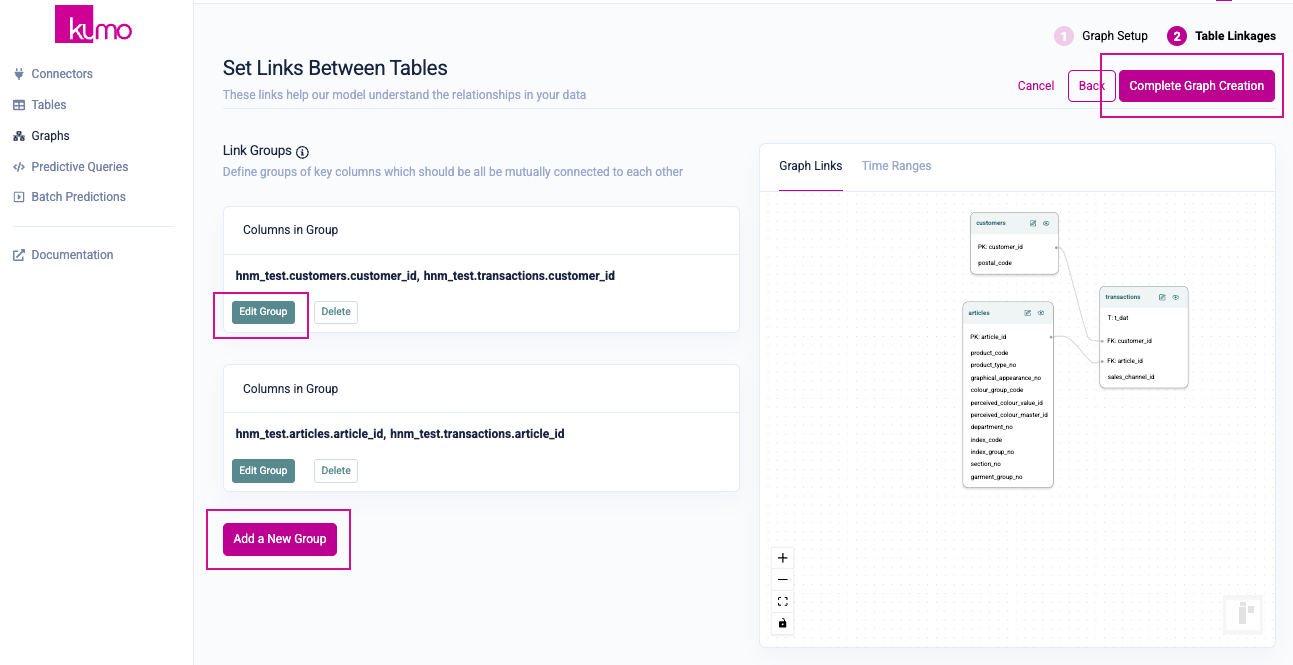
If you need to make changes to your column groupings, you can click the Edit Group button, or click Add a New Groupto create a new column grouping. Otherwise, click the Complete Graph Creation button to finish creating your graph
Verifying Your Graph Linkages
After creating your graph, Kumo will route you to the graph detail page where you can analyze insights regarding your new graph's connectivity.
The "Graph Link Health" table on the bottom of the page contains health metrics that display the match percentages between each pair of linked tables. Lower-than-expected percentages may be symptoms of poor data quality or incorrect column pairings.
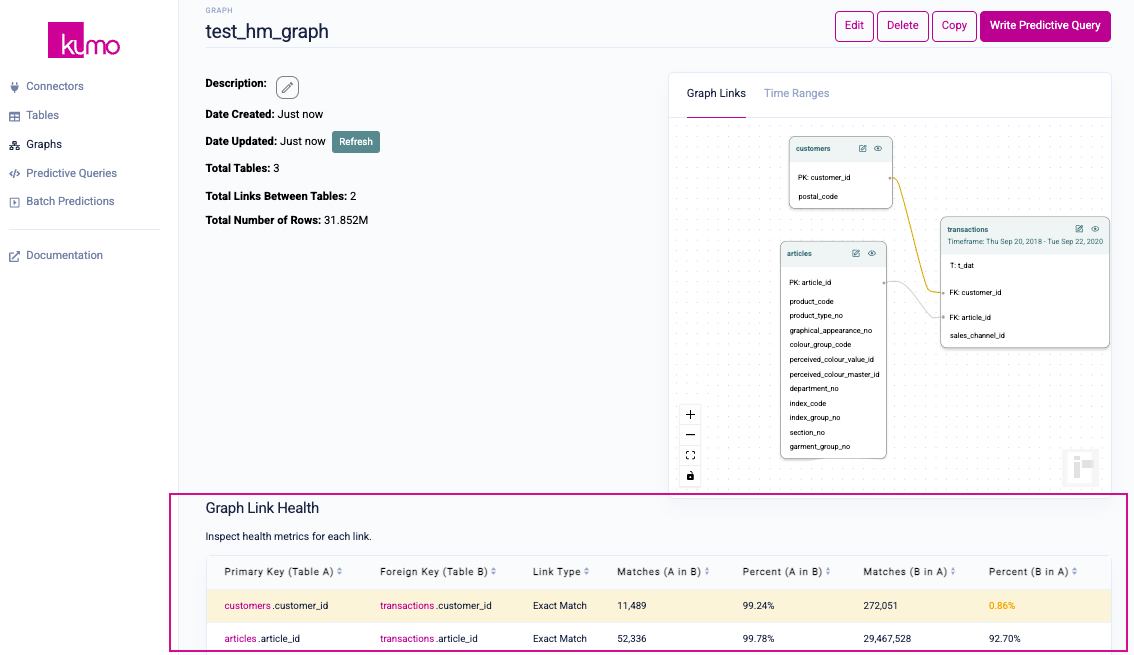
If your graph is in line with expectations, click the Write Predictive Query button to start creating your predictive queries.
Fixing Data Issues After Graph Creation
You can easily fix data issues in your underlying data table and re-upload your data if you discover data quality issues after creating your graph. The next time you train your predictive query on your graph, Kumo will automatically re-ingest the table and connect the graph using the same connections, but updated values.
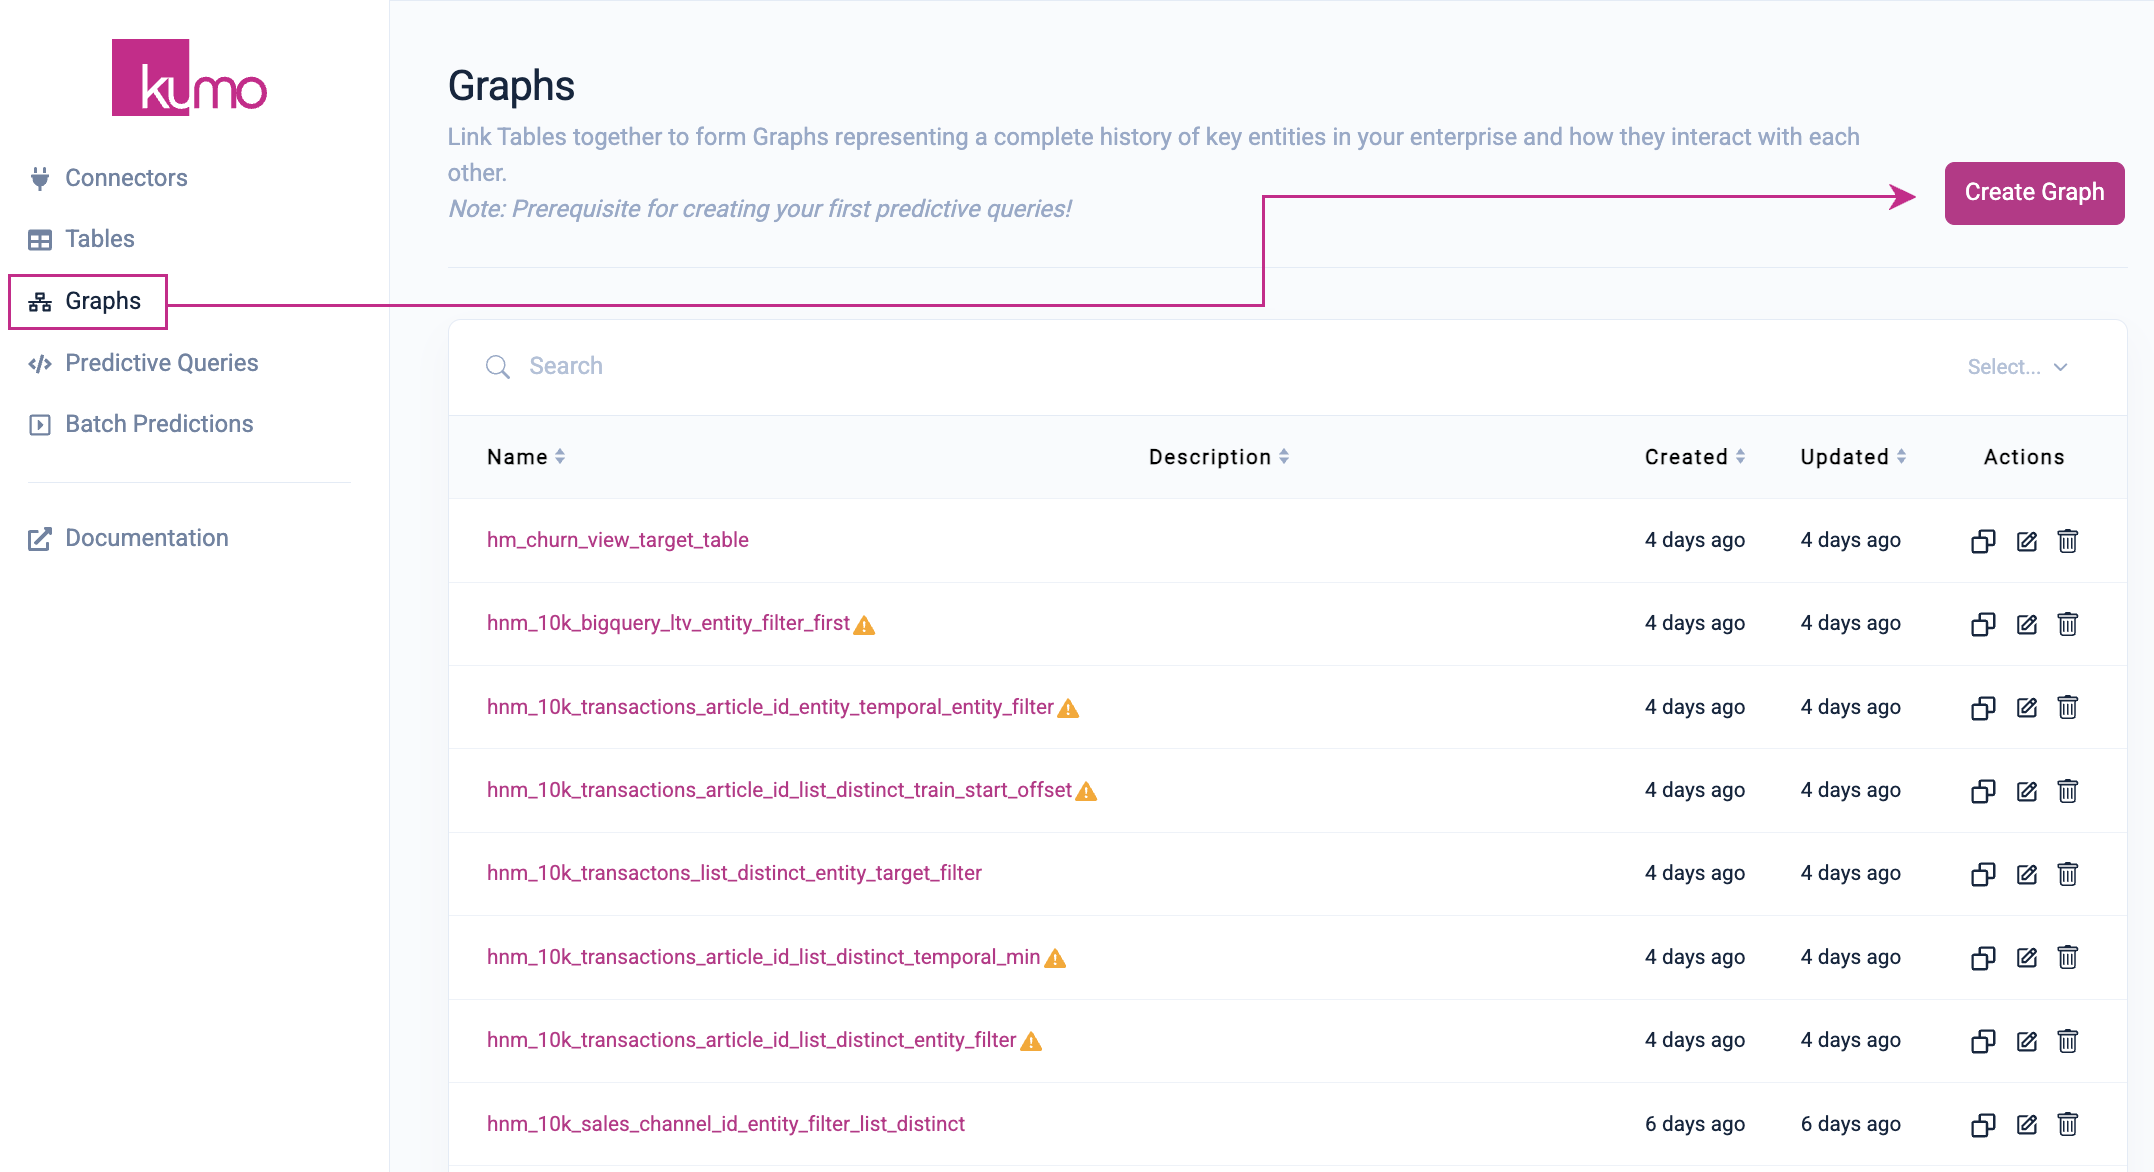
Once you've started creating new graphs, you'll be able to see all of the graphs you've created as well as relevant metadata by clicking on Graphs in the left-hand navigation. Clicking into the details on any one graph allows you to see its connected tables as well as the linkages drawn between those tables through relevant ID columns.
Modifying Tables When Creating/Updating Graphs
If table modifications are required during the graph creation/editing process, you can make the necessary table changes directly from the "Graph" page. This may come in handy on various occasions when you need to make table changes/updates (e.g., you've forgotten to set a primary key or create date, or want to experiment with different column sets), but would like to avoid interrupting your graph creation/editing workflow.
On the right-hand side "Graph Links" pane of the "Graph" page, click the Edit (pencil) icon on the header of the table you would like to modify.
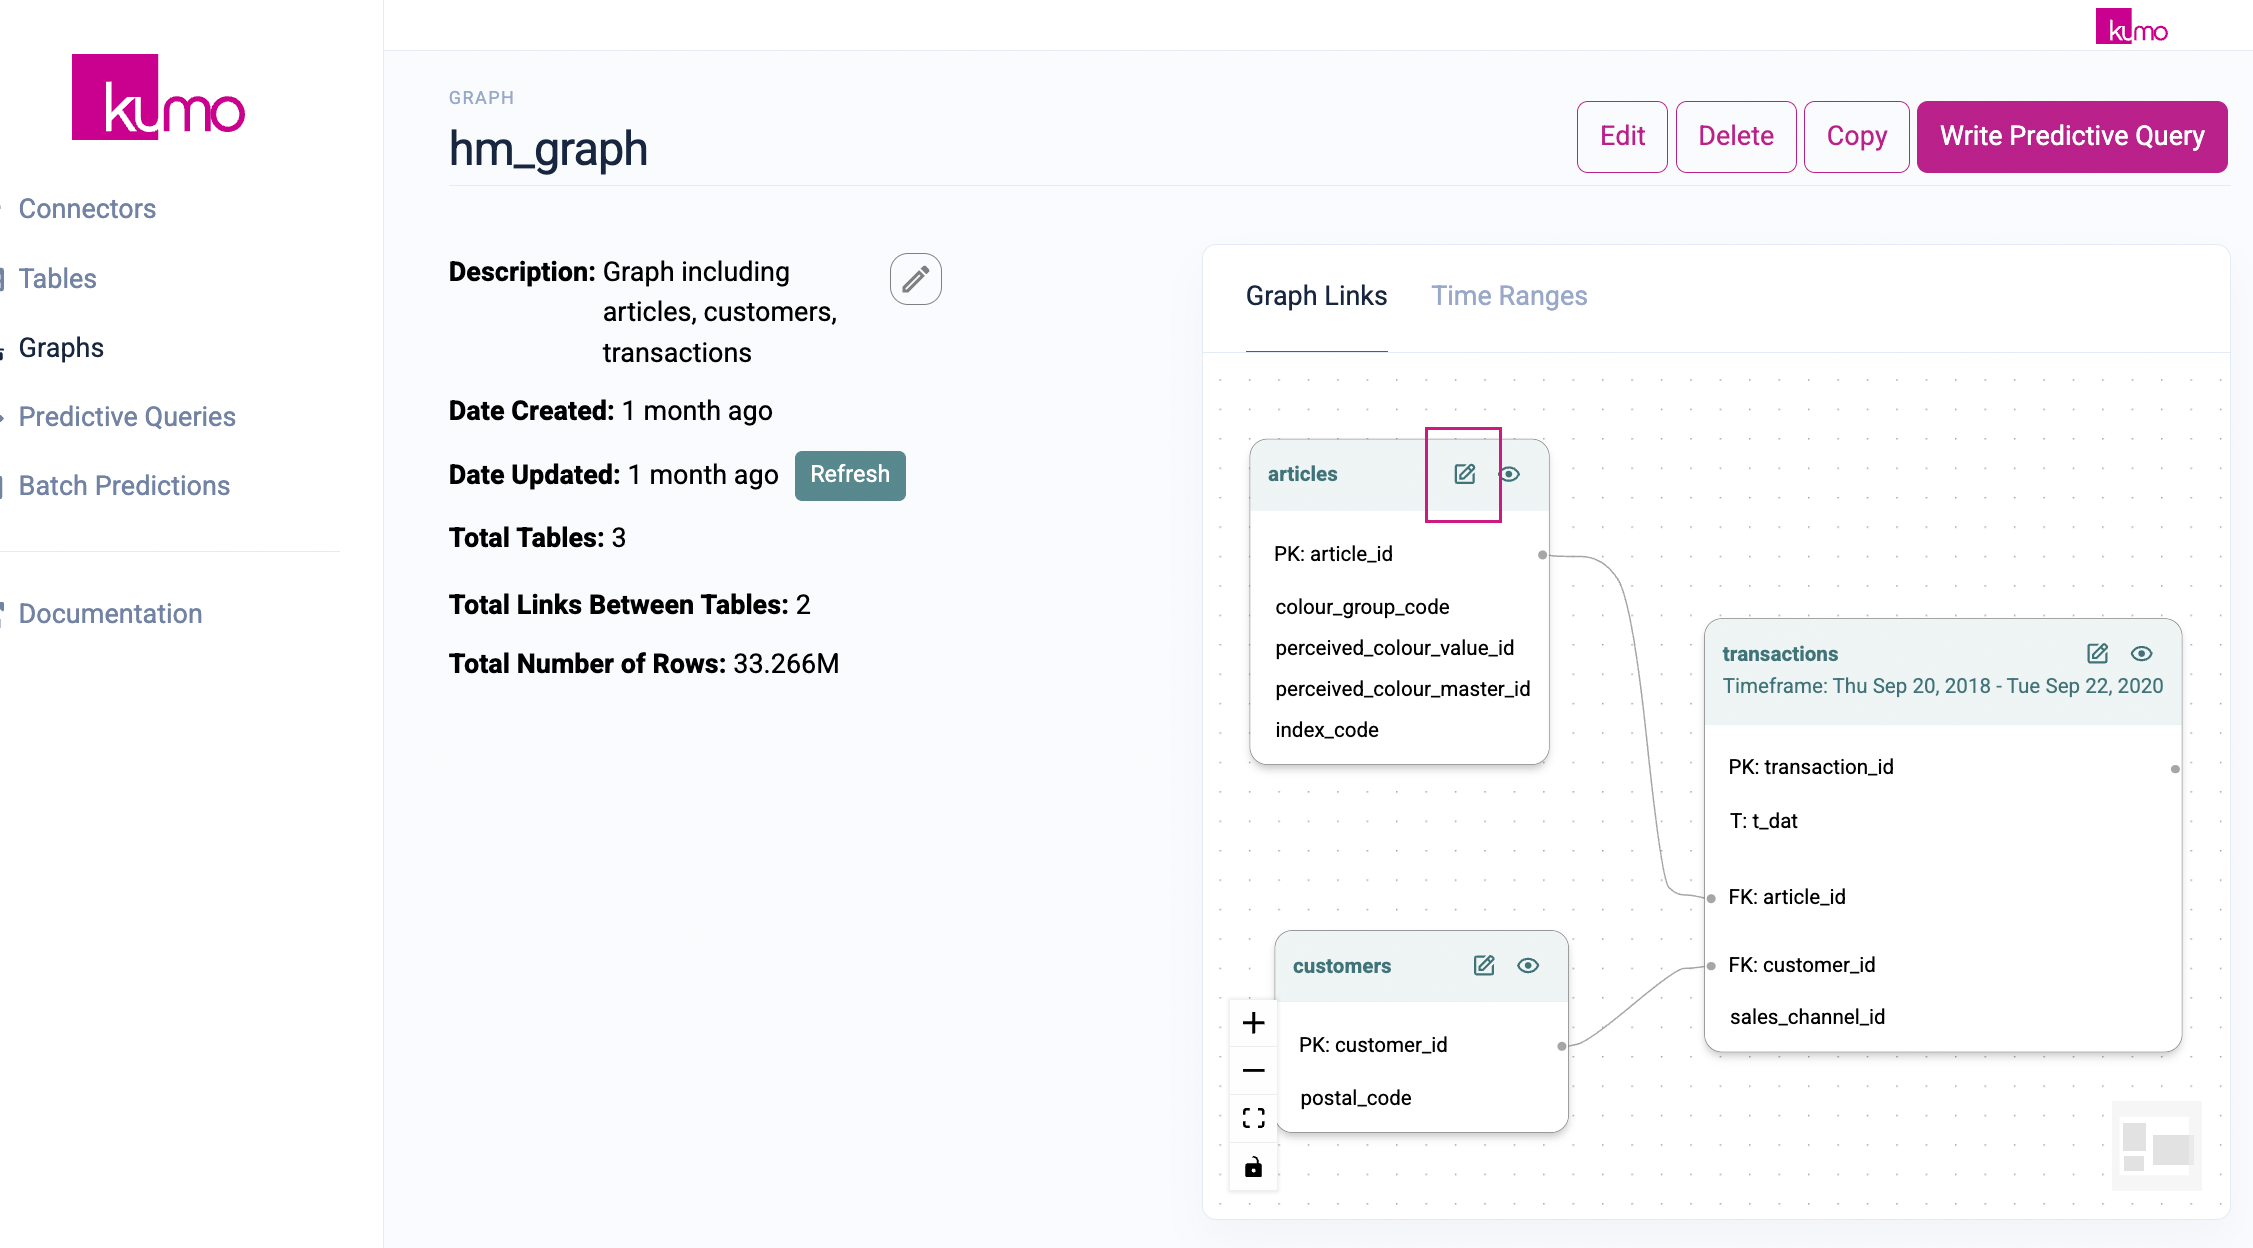
This will load the "Edit Table" modal window directly from the "Graph" page, where you can make the necessary tables changes/edits in place.
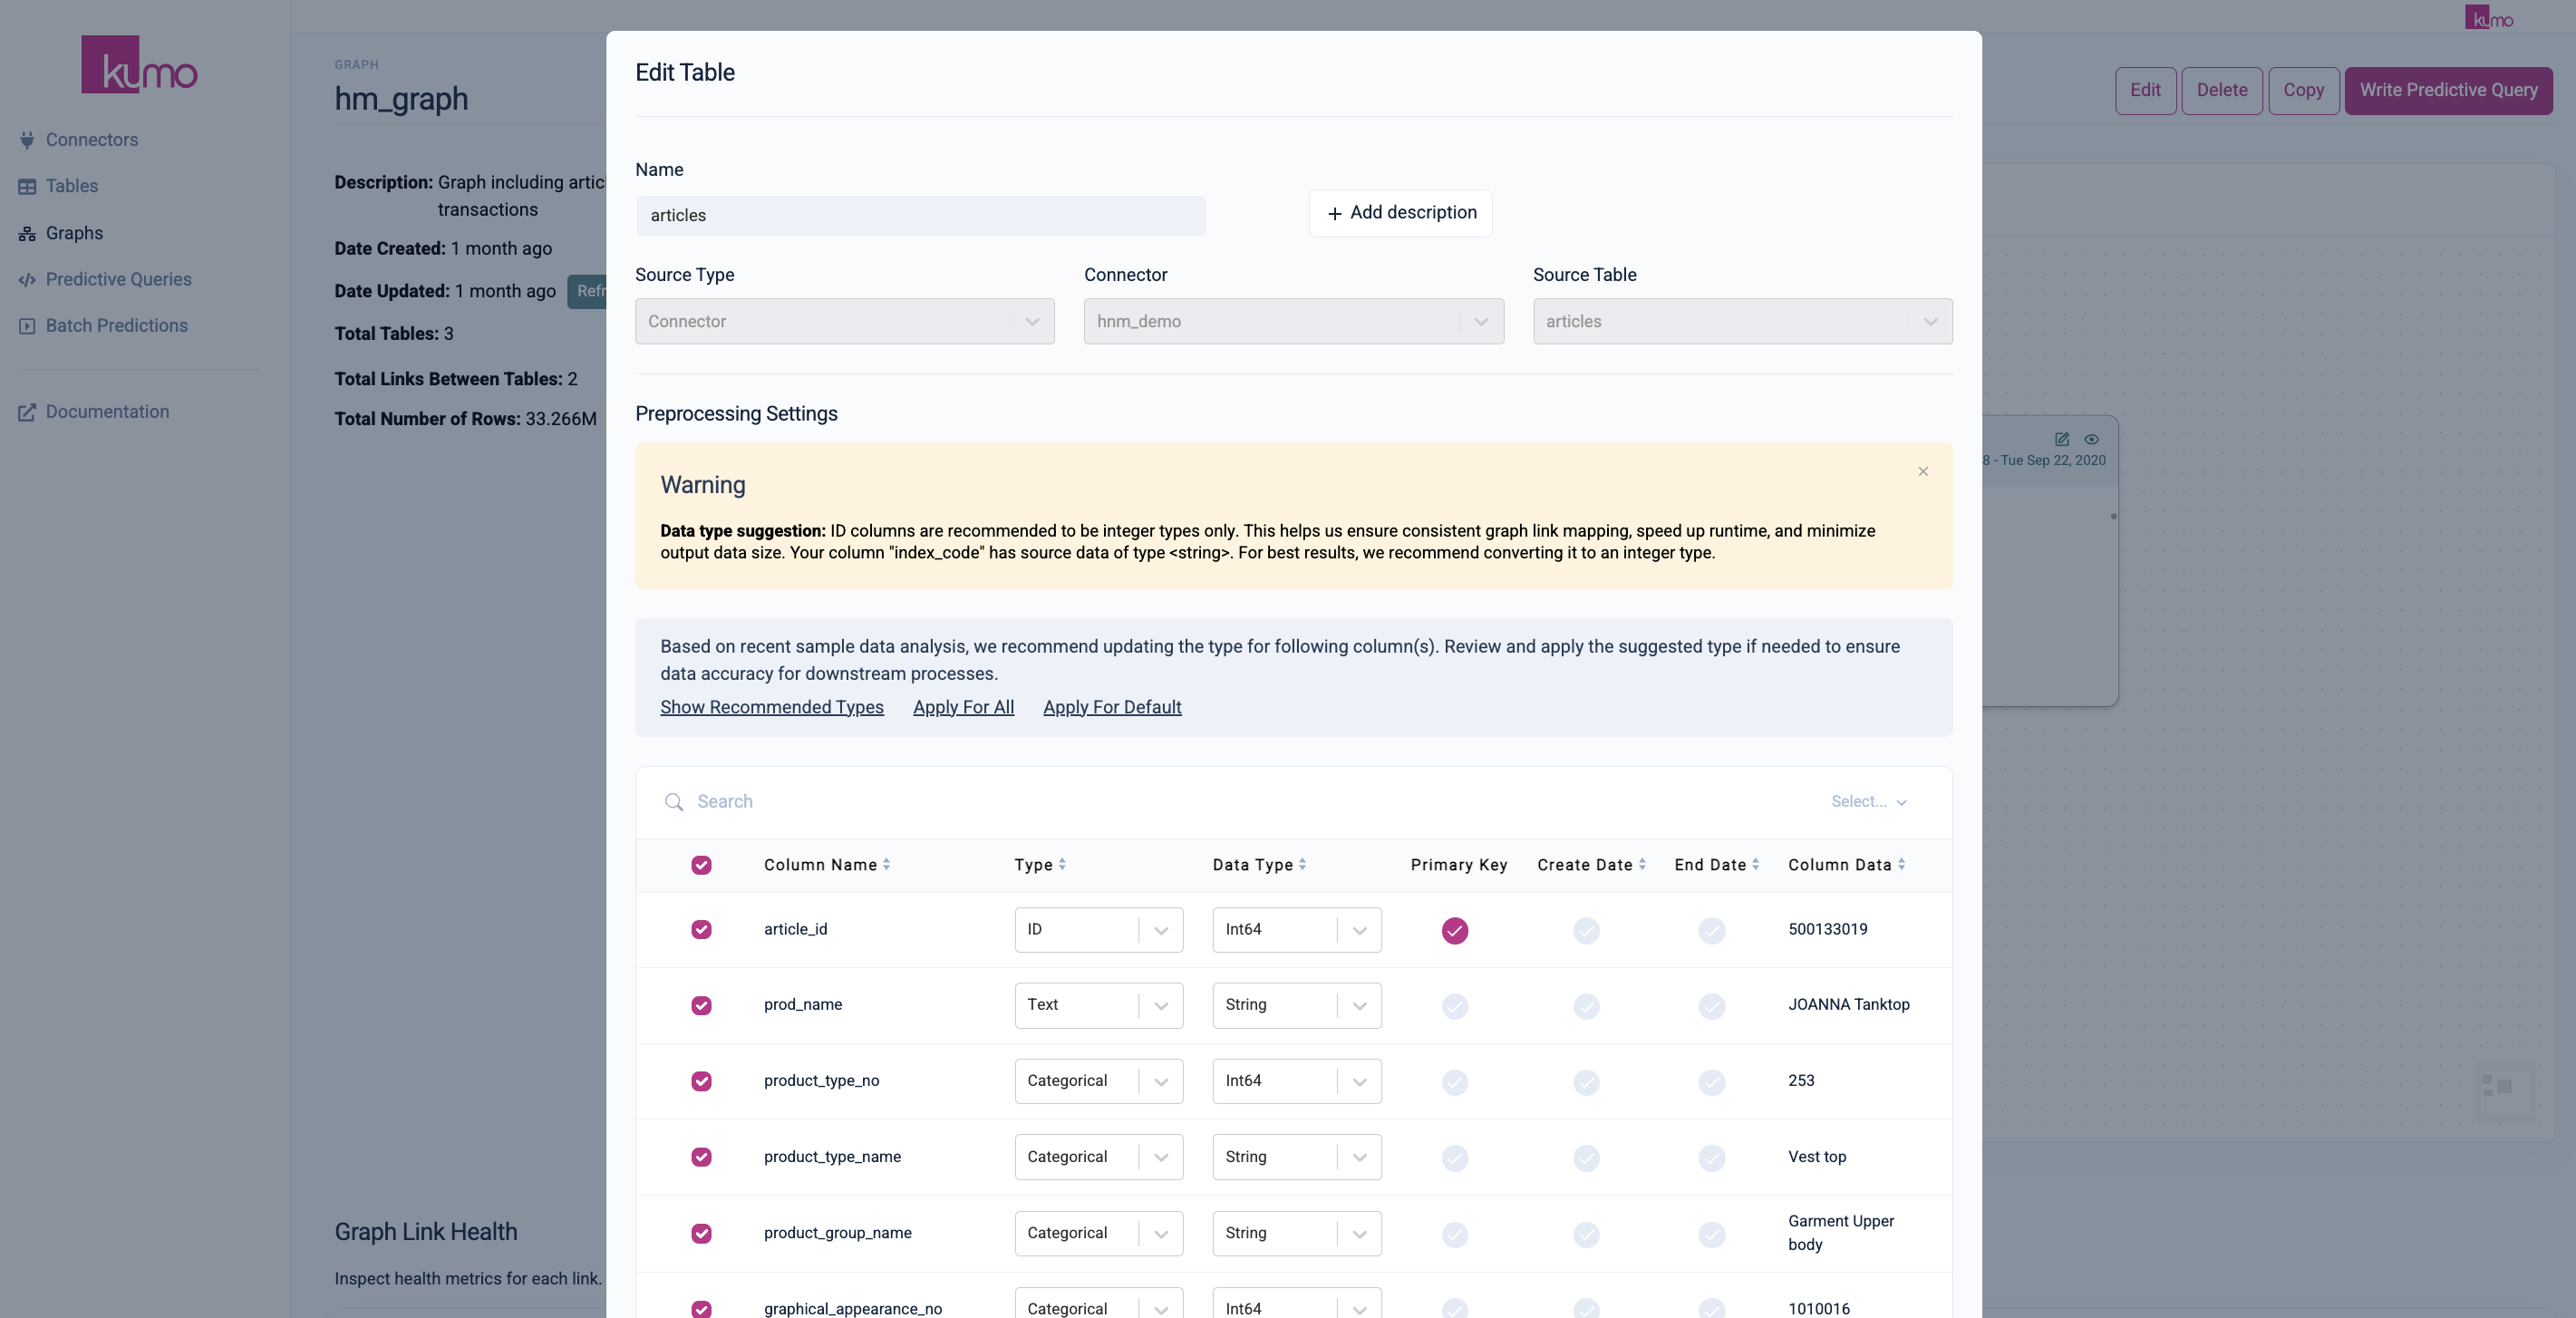
Note: Tables edits are restricted to changes that do not break other dependent objects (e.g., unsetting a primary key column required by another graph that shares the same underlying table)
Updated 2 months ago