Demand Forecasting
Solution background and business value
Demand forecasting is crucial for sales, retail, manufacturing, and supply chain industries. Accurate predictions of future demand helps reduce costs by enabling efficient planning for storage and transportation, preventing waste from overproduction, and strategically timing promotions and campaigns. For example, a culinary delivery service can benefit from demand forecasting by accurately predicting the need for raw food ingredients based on recipe demand. This ensures they order enough materials to meet demand while minimizing waste.
The success criteria focuses on the accuracy of prediction and usually measured by MAE or SMAPE on the desired aggregation resolution. To take food delivery industry as an example: 1) the number of orders for each group recipes for the 6th week out in the future; 2) the number of total demand of each ingredient for the next 28 days.

SMAPE is good for evaluating the model performance tracking and model selection but not very easy to directly interpret as business impact. Whereas the MAE corresponds to business related $-amount savings directly based on the empirical knowledge, and some use cases have different weights for overshooting v.s. undershooting which might consider a customized MAE to measure them separately.

In this solution, you will learn how to use Kumo to:
- Train a forecasting model, custom-tailored to your data schema and business space
- Use the Kumo REST API to export forecasts to your data warehouse for further analytics and applications
Kumo’s Predictive Query Language is highly flexible, and enables teams to quickly experiment with many different forecasting settings and definitions, to learn which type of forecast yields the best business value gain. Here are just some examples listed in this solution:
- Forecast demand as the count of sales for each item
- Forecasting demand as the sum of item quantity
- Forecast demand on a secondary granularity (e.g. on order category vs. individual item order)
- Forecast in a specific future time-range
Data requirements and Kumo graph
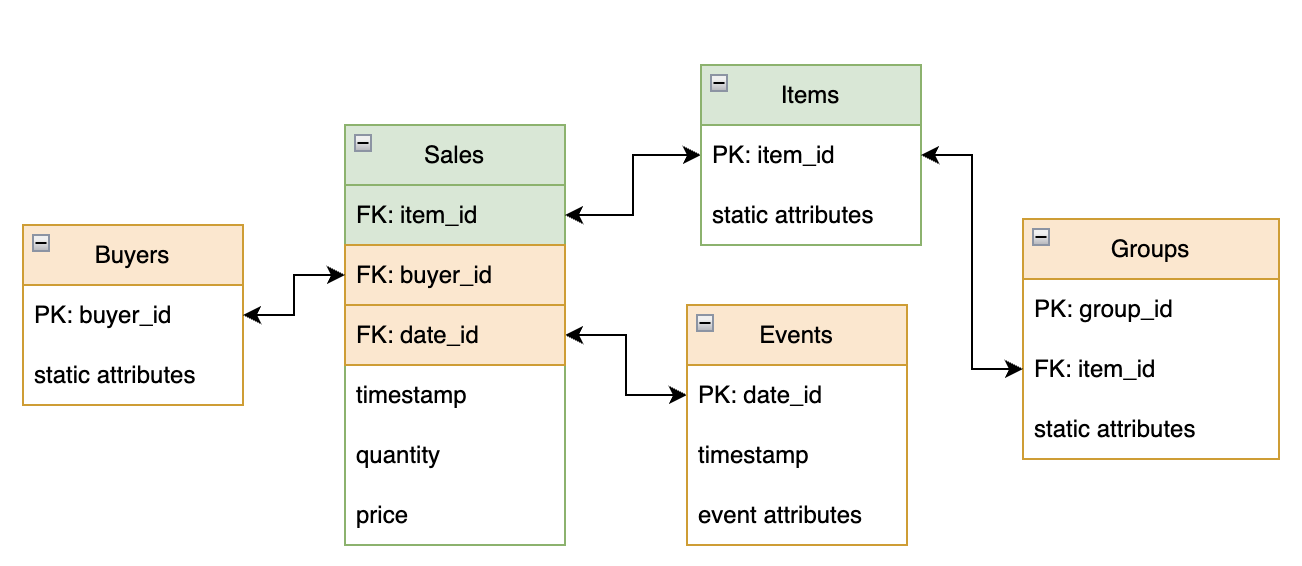
Core tables
Regardless of approach taken, two core tables will be needed to tackle this use case. Below is an non-exhaustive list of what data needs to be included:
- Sales/Orders Table: This table should include a
timestampandentity_idto link each sale or order to specific entities. - Entity Table: This table holds static information about the entities of interest, and should include a unique
entity_idfor each entity.
Additional table suggestions
Additionally, the following optional tables can enhance the accuracy and performance of demand forecasting:
- Events, Holidays, and Other Temporal Tables (Optional): External signals such as seasonality, weather, and events can significantly impact demand. Including these signals, with associated timestamps, descriptions, and numeric representations, can improve forecasting accuracy.
- Groups (Optional): Beyond the primary entities table linked to the sales/orders table, secondary items tables can provide different levels of prediction resolution. For instance, in a culinary delivery service, the primary entities table might contain individual recipes, while a secondary table could categorize these recipes. This coarser granularity allows for grouping and overlapping recipes within categories, offering a broader perspective on demand patterns.
- Buyer-side entity tables (Optional): Buyer-side entity tables should contain some static features and
user_idwhich can be connected to sales/orders table. This group of tables can help with cold-start for both new buyers and new items because new buyers can leverage the buyer-side feature patterns GNN learned from past orders and new items can also have reasonable predictions based on what buyers are interested from their past orders.
Predictive query
Demand forecasting predicts the count of orders or sum of quantities over a period of time defined by (START_DAYS, END_DAYS] for an item or a group of item. A typical minimal Predictive Query looks like the following
// Assuming no quantities column and each order corresponds to 1 order.
PREDICT COUNT(Sales.*, START_DAYS, END_DAYS)
FOR EACH Items.item_id

// Assuming demand is defined as sum of quantities.
PREDICT SUM(Sales.quantity, START_DAYS, END_DAYS)
FOR EACH Items.item_id

// Assuming we want to predict on a different granularity defined by "Secondary"
PREDICT SUM(Sales.quantity, START_DAYS, END_DAYS)
FOR EACH Groups.group_id

// An example of predicting 6th week in the future
PREDICT SUM(Sales.quantity, 35, 42)
FOR EACH Groups.group_id
A common challenge we face in regression problems is that, some times the training table is overwhelmed with a lot of zeros which might hurt the performance. We could adopt an assuming statement to mitigate the problems.
PREDICT SUM(Sales.quantity, START_DAYS, END_DAYS)
FOR EACH Groups.group_id
ASSUMING SUM(Sales.quantity, START_DAYS, END_DAYS) > 0
Deployment
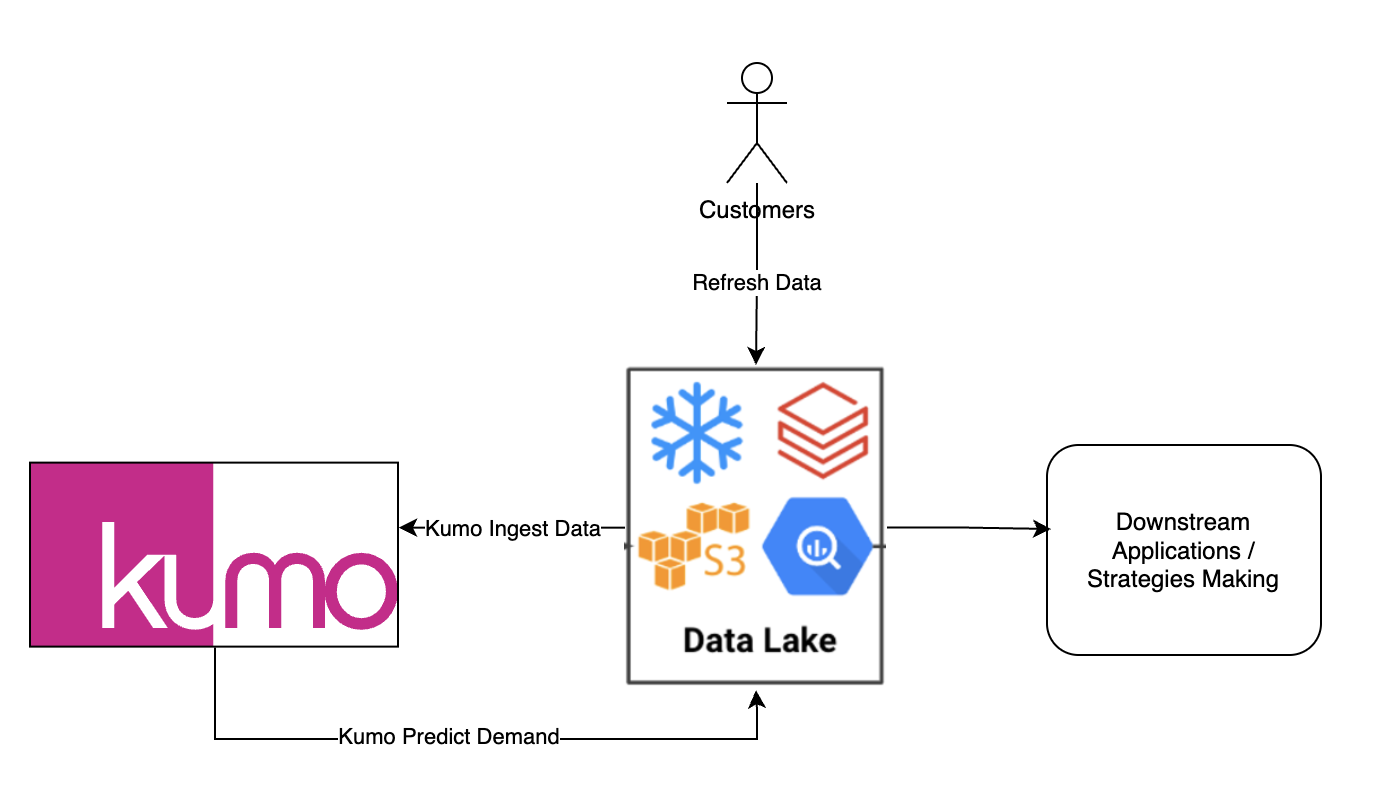
Usually, the demand forecasting runs on a scheduled cadence (daily, weekly or monthly) and write data back to customer owned data persistent service. Then the results might be examined manually by analytics to make strategic decisions on marketing, sales, supply chain related tasks or the results are automatically consumed by downstream (non)-AI solutions. The typical data flow looks like the following
-
Data is refreshed with the most recent snapshots which include up-to-date sales and dimension table for entities, this operation most commonly happens at the data warehouse level
-
KUMO ingest the data and predict the values for future demand. The predictions are written to the desired output location via REST API call
Depending on the actual model architecture, we might need to do some data transformation because the activation function might produce negative values (e.g., LeakyReLU)
SELECT item_id, CASE WHEN TARGET_PRED < 0 THEN 0 ELSE TARGET_PRED END AS TARGET_PRED FROM PREDICTIONS -
The predictions are consumed by downstream applications or additional data analytics is performed on the output data.
Updated 3 months ago