Training
How Predictive Query Training Works
During the training process, Kumo creates a table of historical data slices to use as examples, each specifying a historical context (e.g., all historic data relevant to customer A, up to July 3, 2018) and target (i.e., customer A will spend $30 in the next 2 months). These training tables are materialized one timeframe at a time, starting with the most recent examples.
Training and Validation
Kumo starts the training process by partitioning your historical training examples into three sets:
- Holdout Data Split: The most recent timeframe(s) of training examples, used for evaluating the model on how well it generalizes to future unseen data, and entirely kept out of the model training process.
- Validation Data Split: The second-to-most recent timeframe(s) of training examples, used during the neural architecture search experimentation process for determining which model coming out of the experimentation process is best for promoting to an evaluation on the holdout data split.
- Training Data Split: All remaining earlier timeframe(s) of training examples, used for training each of the models created during the experimentation process.
Each experiment is trained on the training data split, then evaluated on the validation data split.
For more information about training data splits during predictive query training, please see the Model Planner and AutoML section.
Model Planning
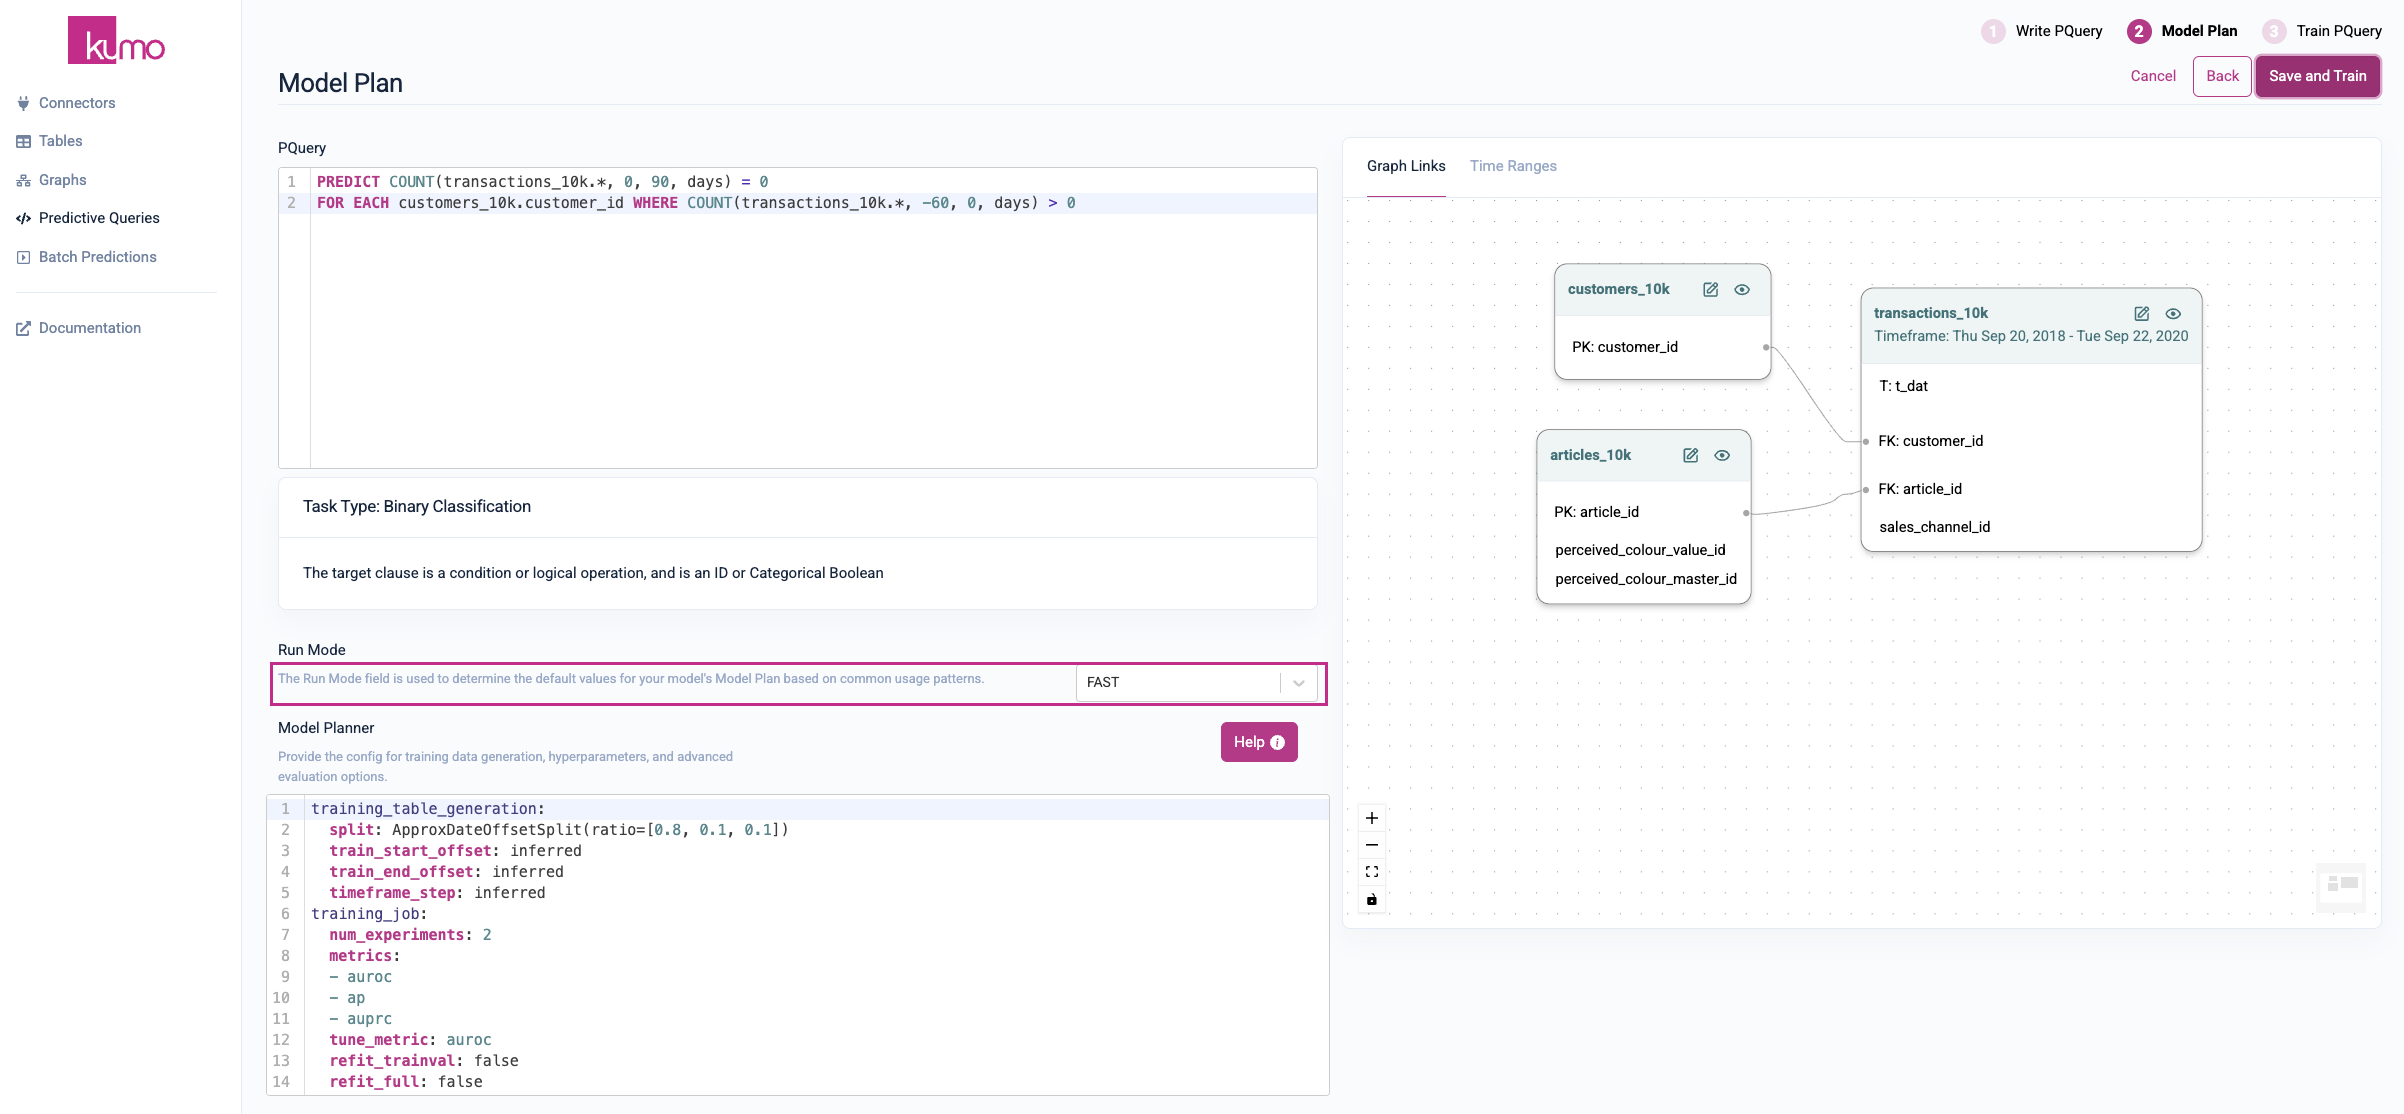
After writing your predictive query, the next step is to configure/confirm your model plan.
Under "Run Mode", you can set the run mode for your model plan. Select the run mode that best suits your particular scenario:
- Normal: Default value.
- Fast: Speeds up the search process—typically about 4x faster than using the normal mode.
- Best: Typically takes 4x the time used by the normal mode.
By default, Kumo decides the size of the search space so that the search completes in a reasonable amount of time, and yields a close-to-optimal result. This happens automatically under the "Normal" run mode. However, depending on your budget for training time, you may configure a longer or shorter training time duration.
Keep in mind that there is a trade-off between search time and optimal search results.
Under "Model Planner", you can set specific configurations for your pQuery's training data generation, hyperparameters, and other advanced evaluation options. Kumo automatically provides model planning configuration settings that should work best in most cases; however, advanced ML practitioners can edit them as required.
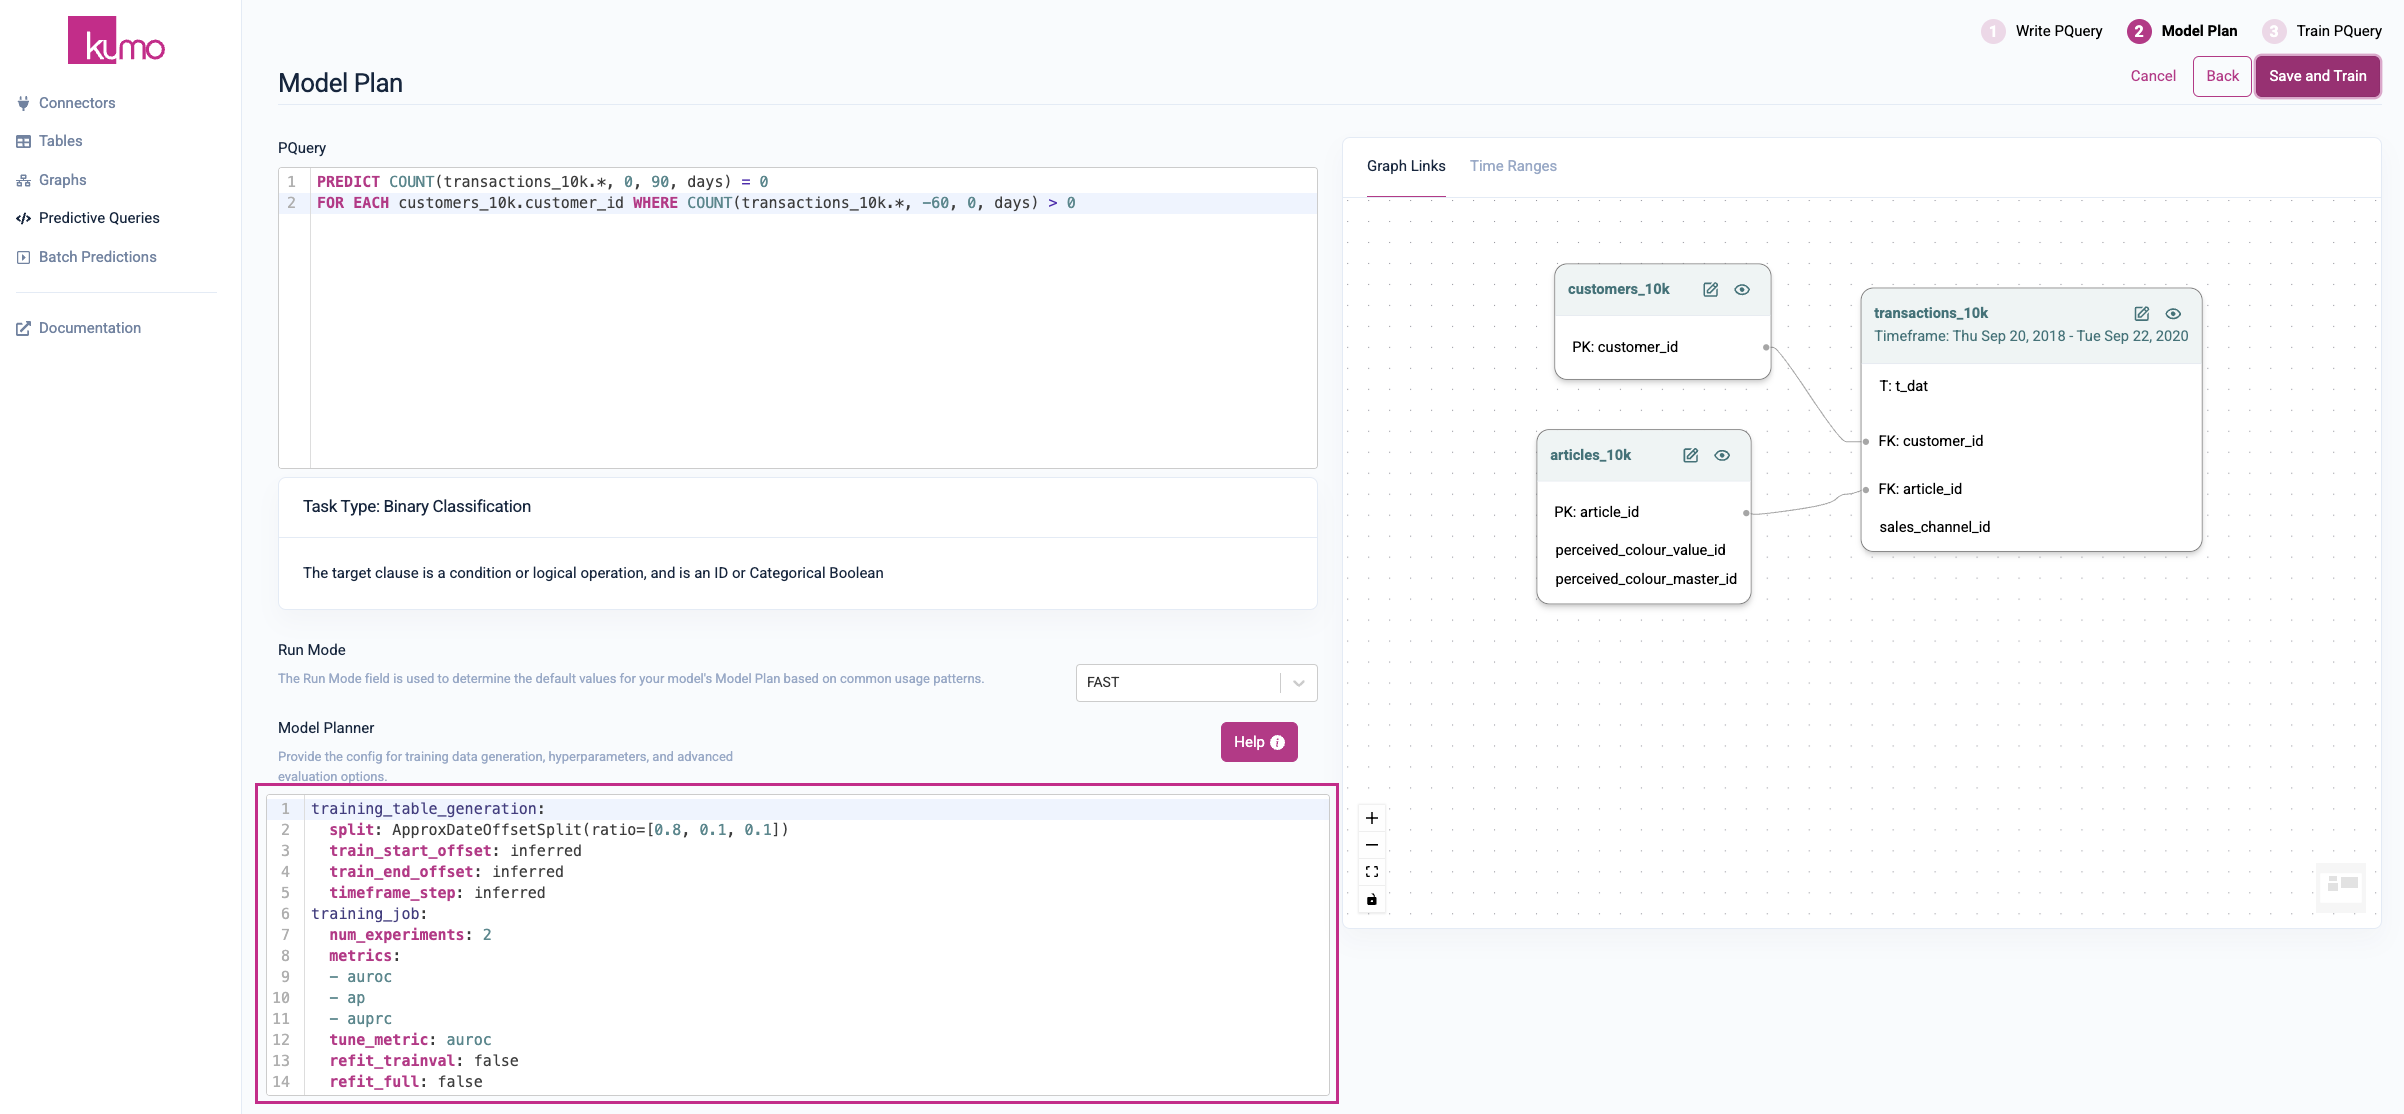
To learn more about the model planning configuration options and settings, click on the Help button or view the Model Planner Options in this guide.
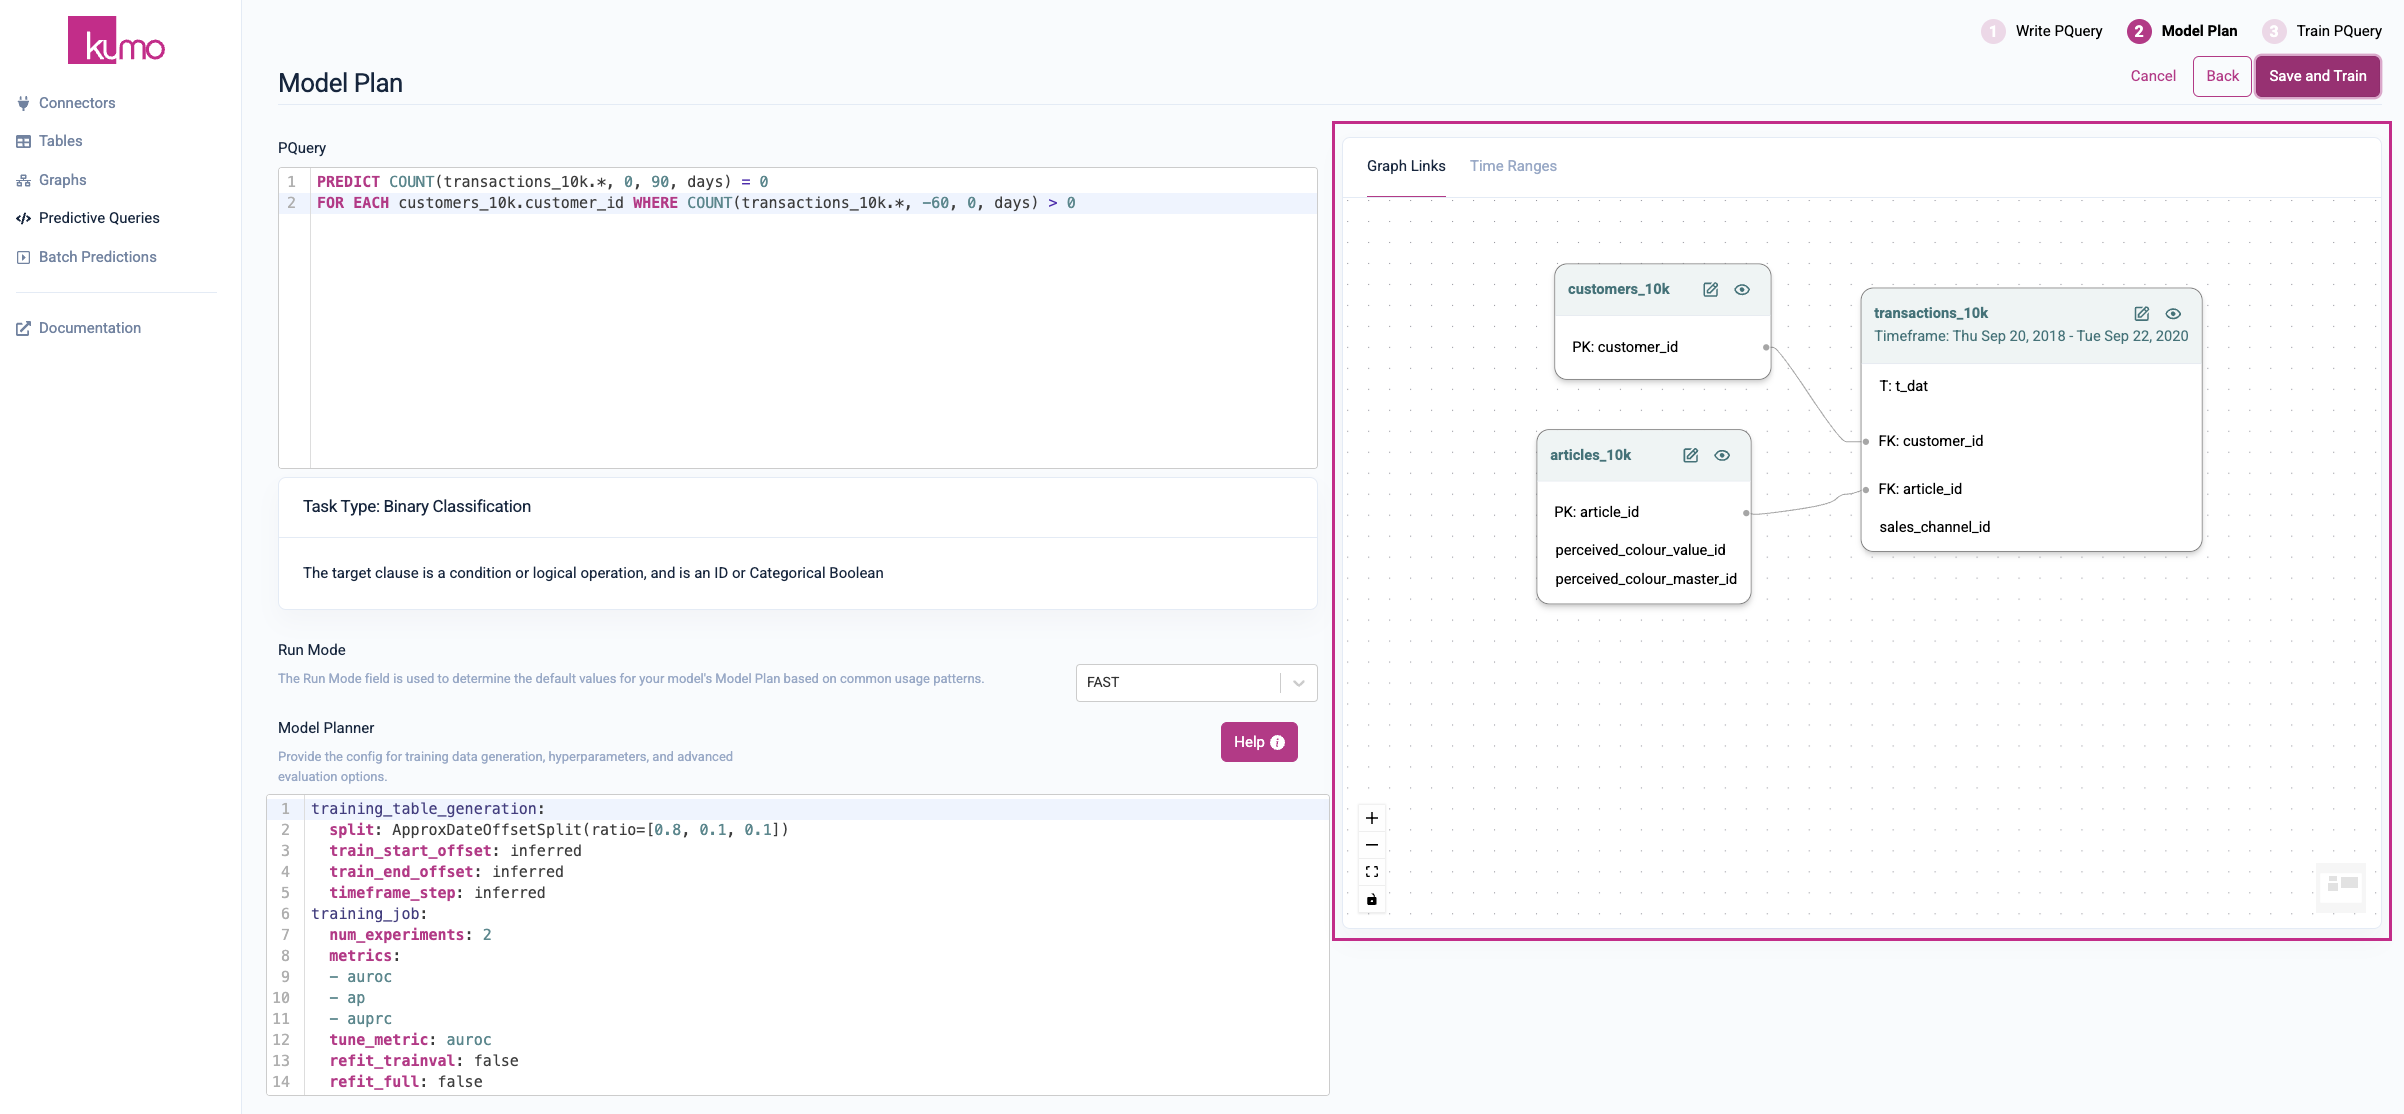
You can also view graph links of your tables, as well as time ranges for checking the degree of overlap (for each table in your graph with a time column).
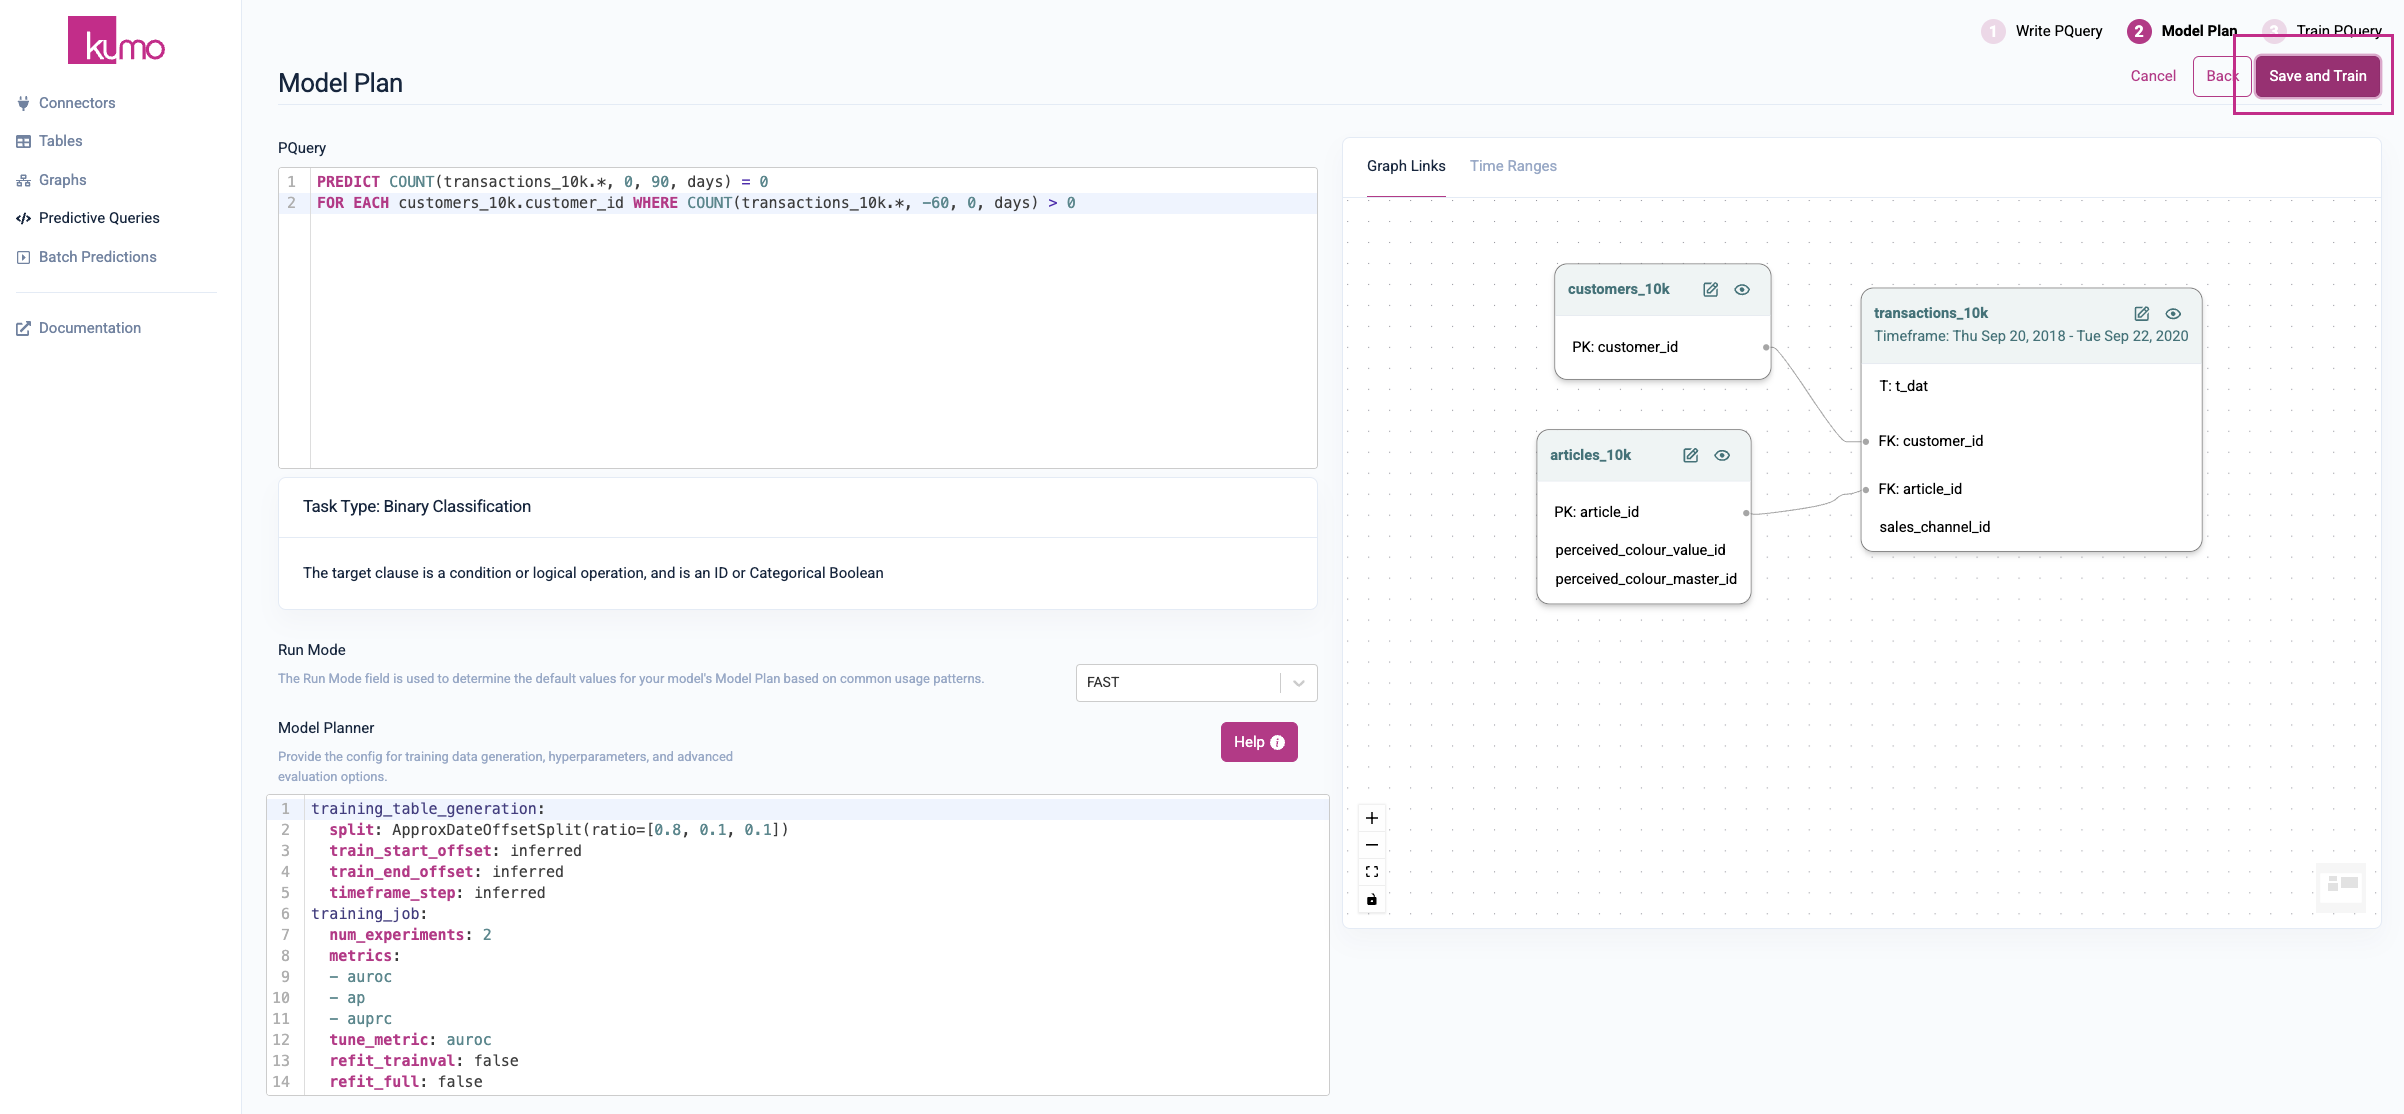
Click the Save and Train button to start training your model.
Training Your Predictive Query
Once you click the Save and Train button, Kumo immediately launches a training job that finds the optimal set of ML parameters for your pQuery. Depending on the size of your graph (i.e., the combined size of its underlying tables), this job usually takes between 1 and 10 hours.
You can quickly check the status of your training job by click on the Overview tab of your pQuery.
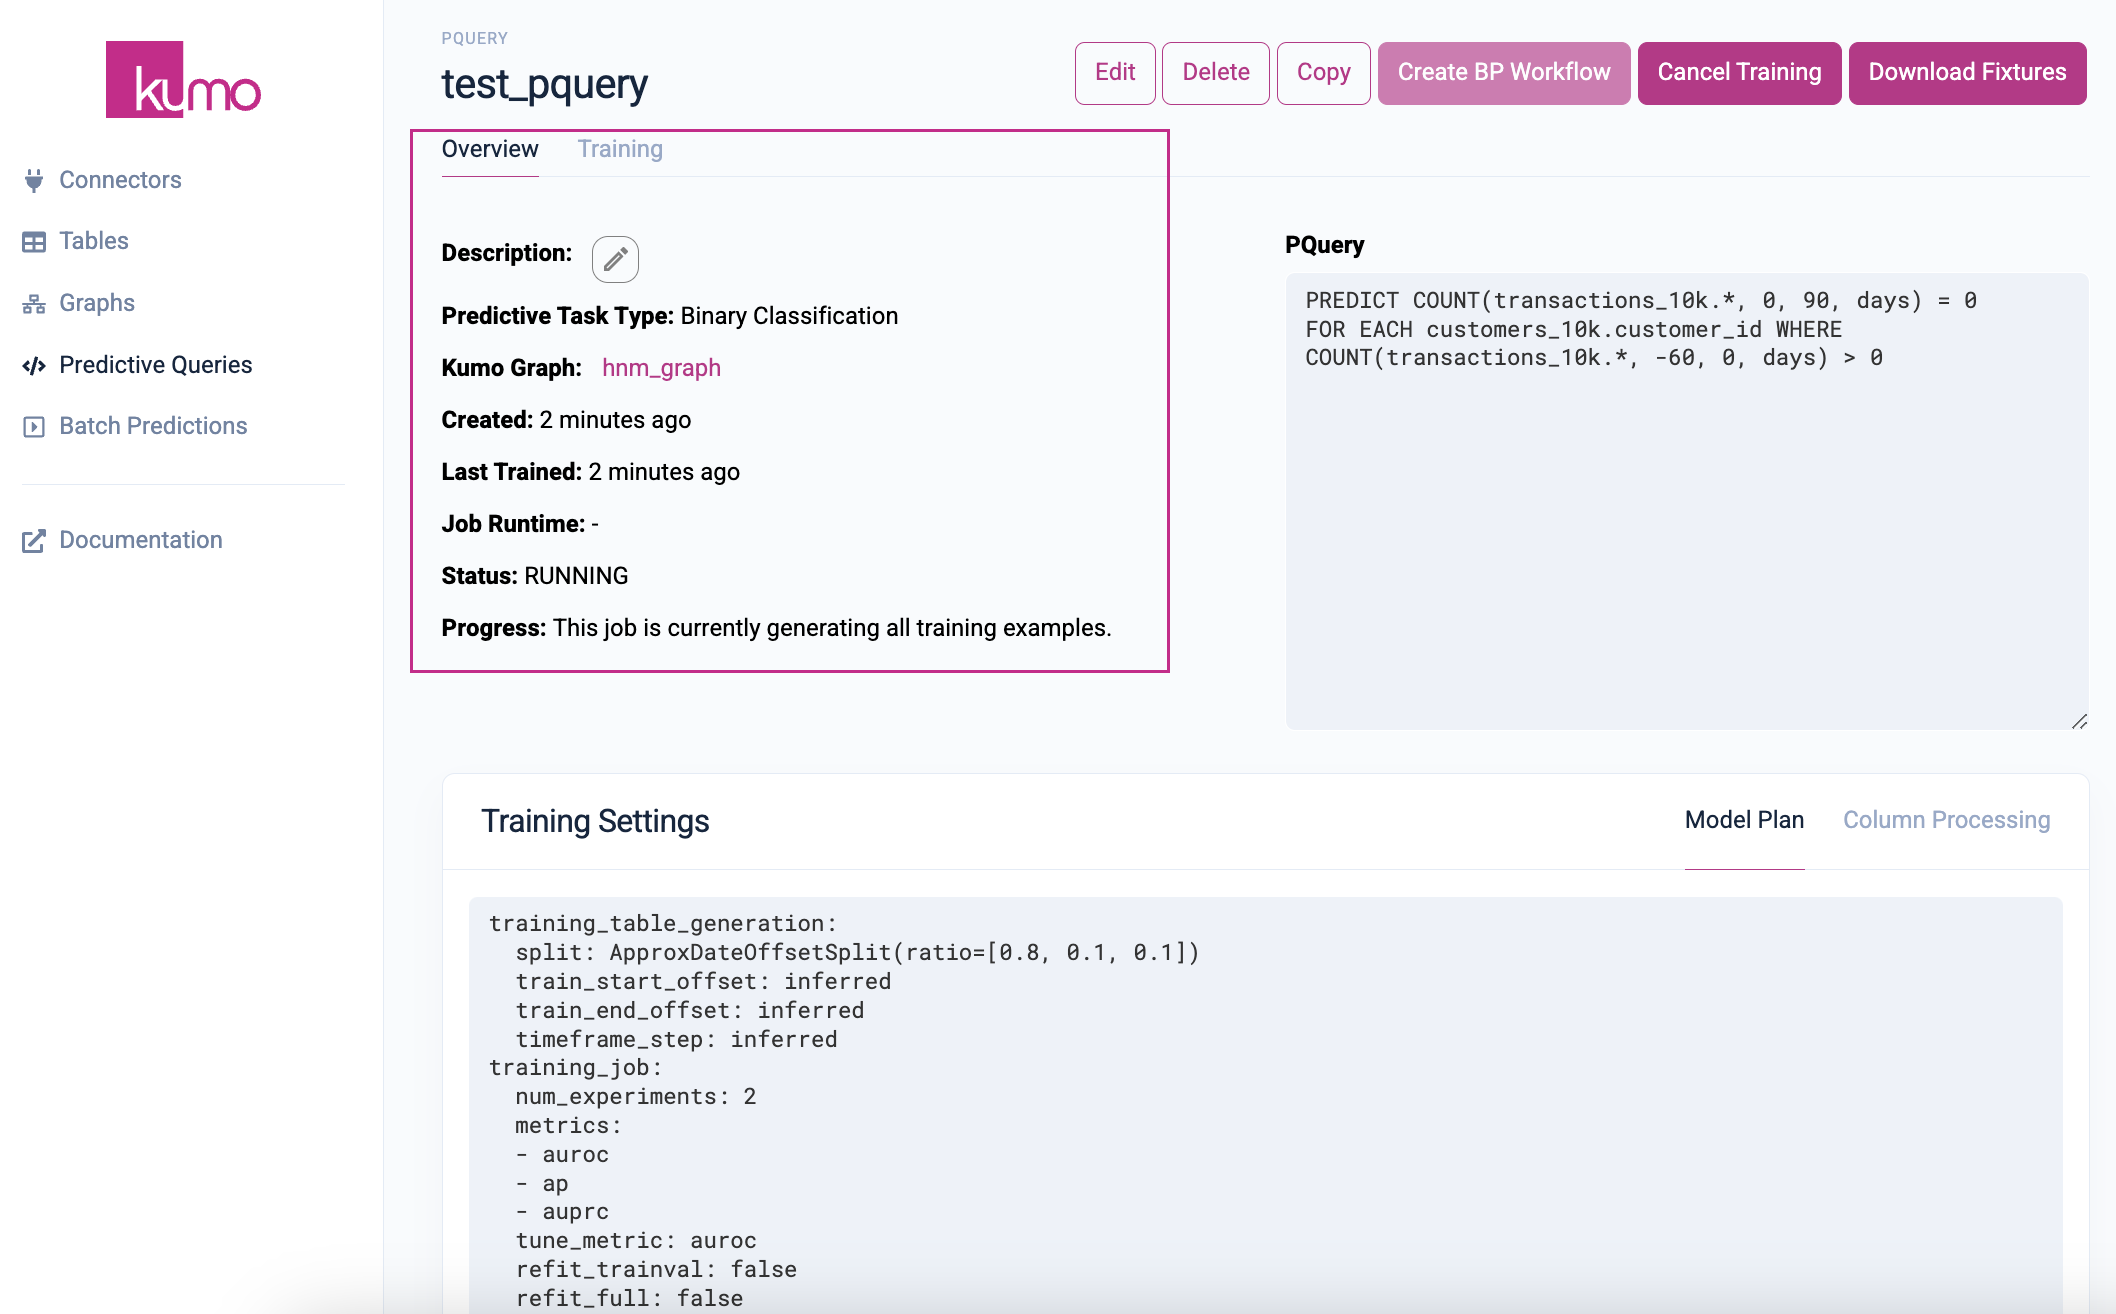
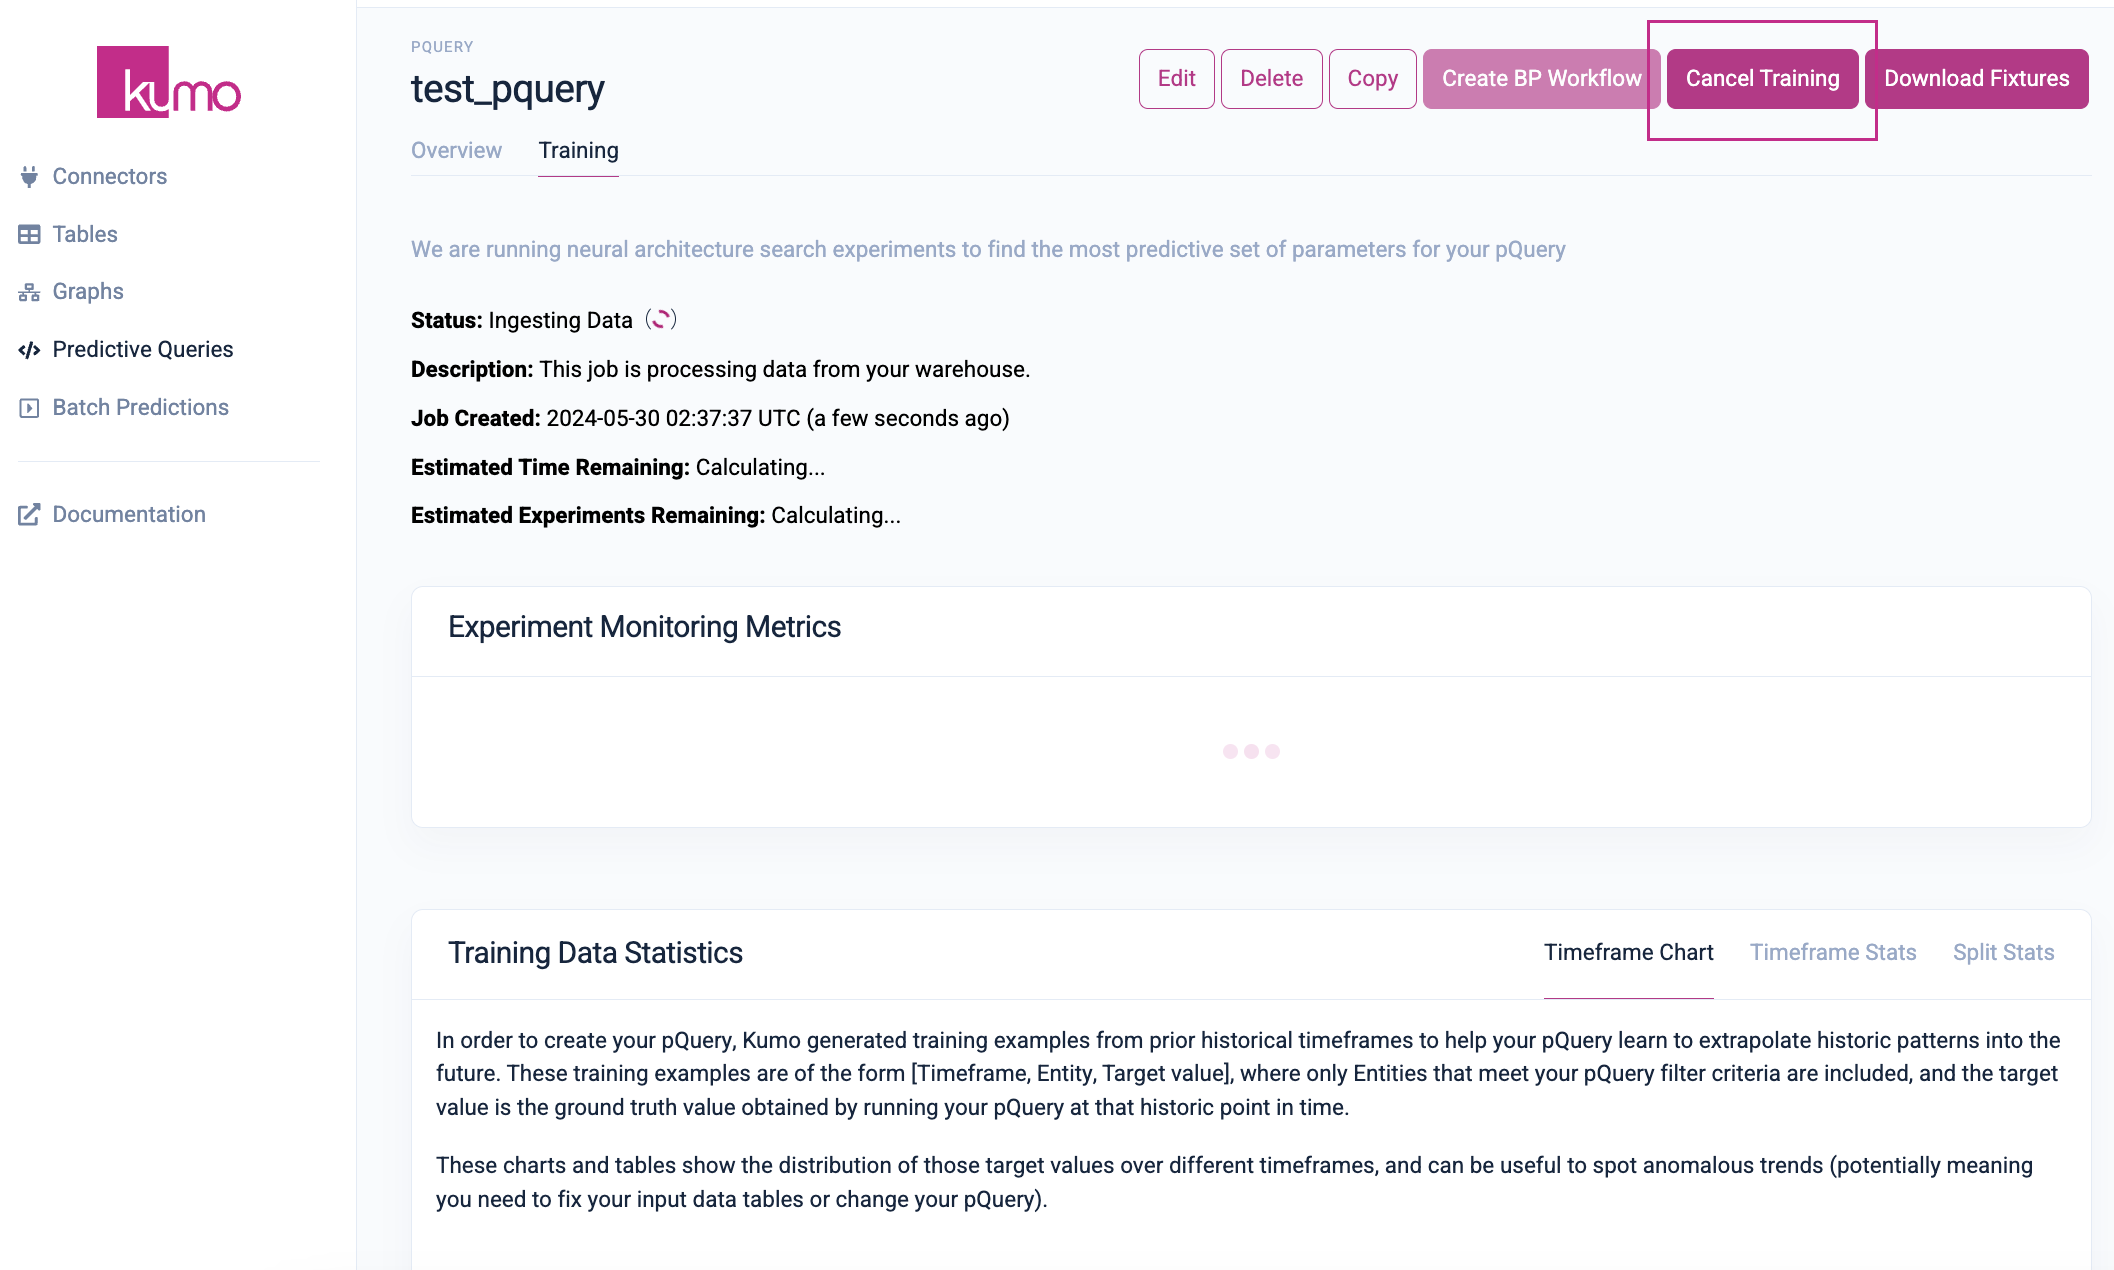
Clicking on the Training tab will allow you to view experiment monitoring metrics and training data statistics in realtime.
If your pQuery training stalls or becomes problematic, click the Cancel Training button to cancel the training and start over.
After this step is complete, the same predictive query can be used at a regular cadence to generate batch predictions, potentially multiple times a day.
Limiting Your Training Window
In some cases, you may want to limit your training window—for example, upon inspecting the time ranges in your data, you may notice that your dataset contains multiple years of data. This may result in prolonged target generation times due to shifting target distributions over time.
To mitigate this, you can use train_start_offset model planner training parameter to defines the numerical offset from the most recent entry to use to generate training data labels, and train_end_offset to define the numerical offset from the most recent entry to not use to generate training data labels. These model planner training parameters will effectively allow you to limit your learning interval and what labels are generated.
For example, we may want to only use training examples for customers that churned in the last year, but those customers may have 10 years of data that we will use for training the model:
train_start_offset: <integer>
train_start_offset: 10 # Only train on data from the last 10 days
train_start_offset: 365 # Only train on data from the last year
NOTE:train_start_offsetandtrain_end_offsetonly apply to temporal queries, like those that use a temporal aggregation likeSUM().
To learn more, please refer to train_start_offset and train_end_offset in the PQuery Reference.
Analyzing Your Training Results
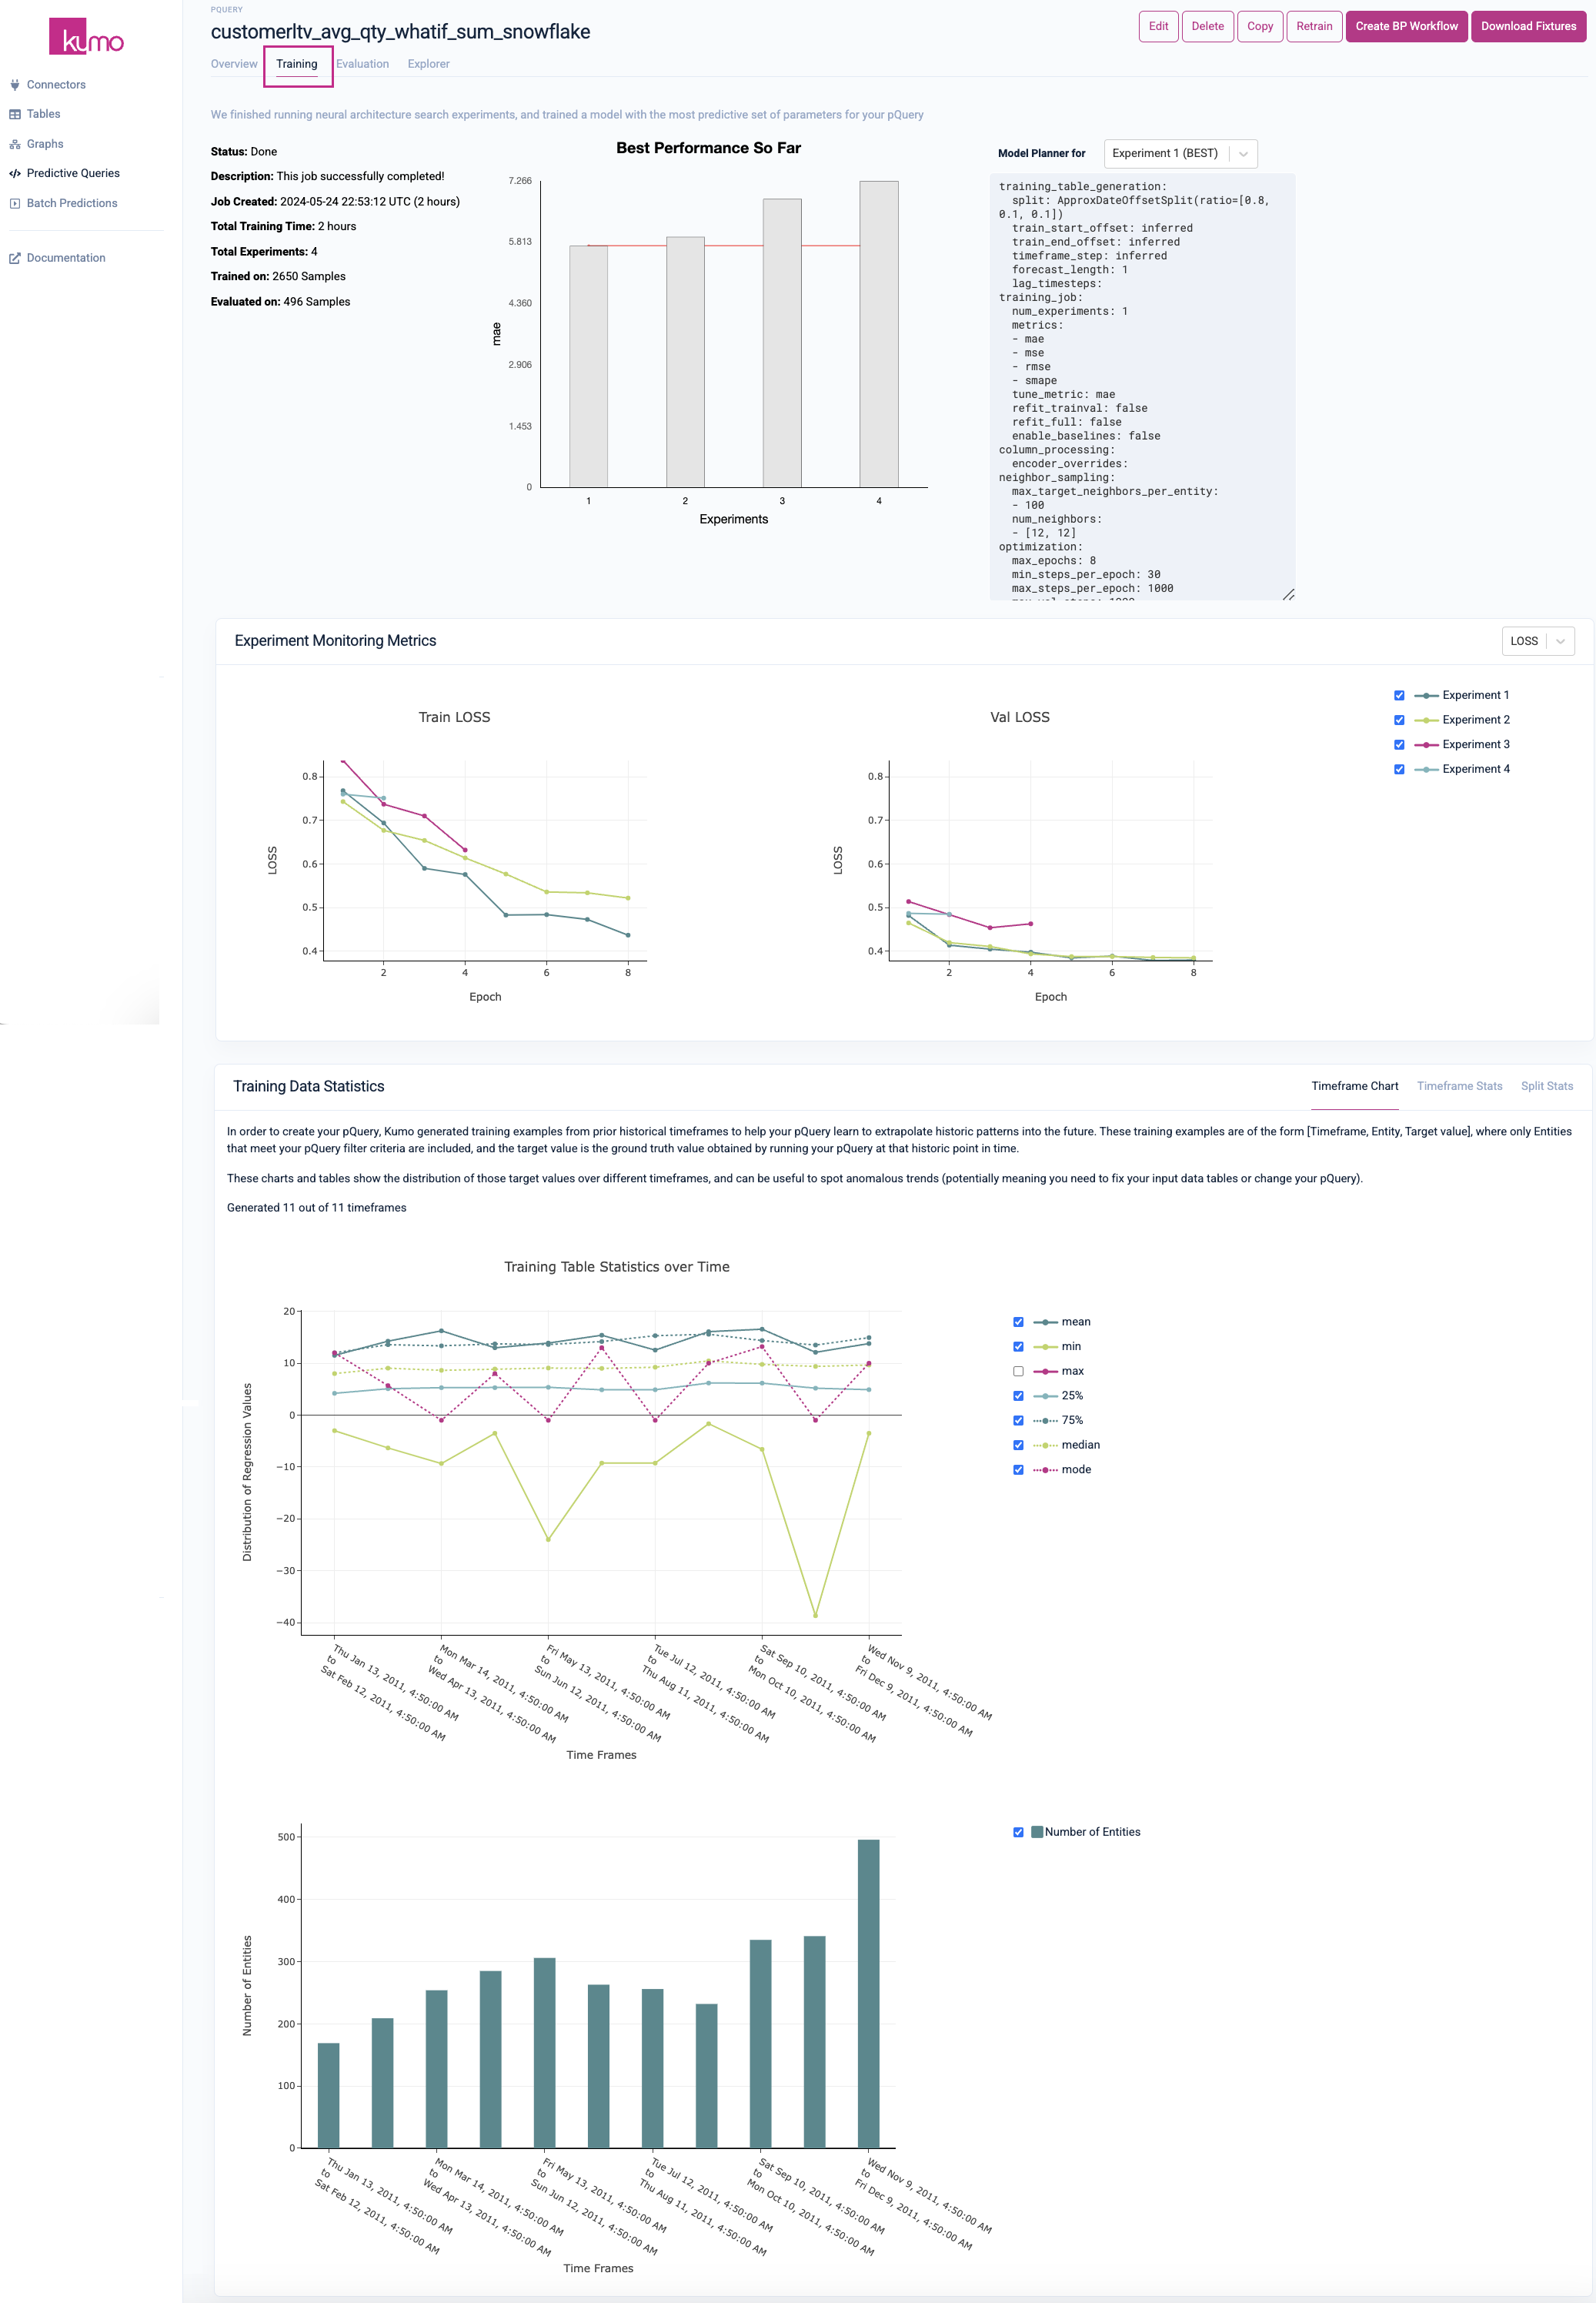
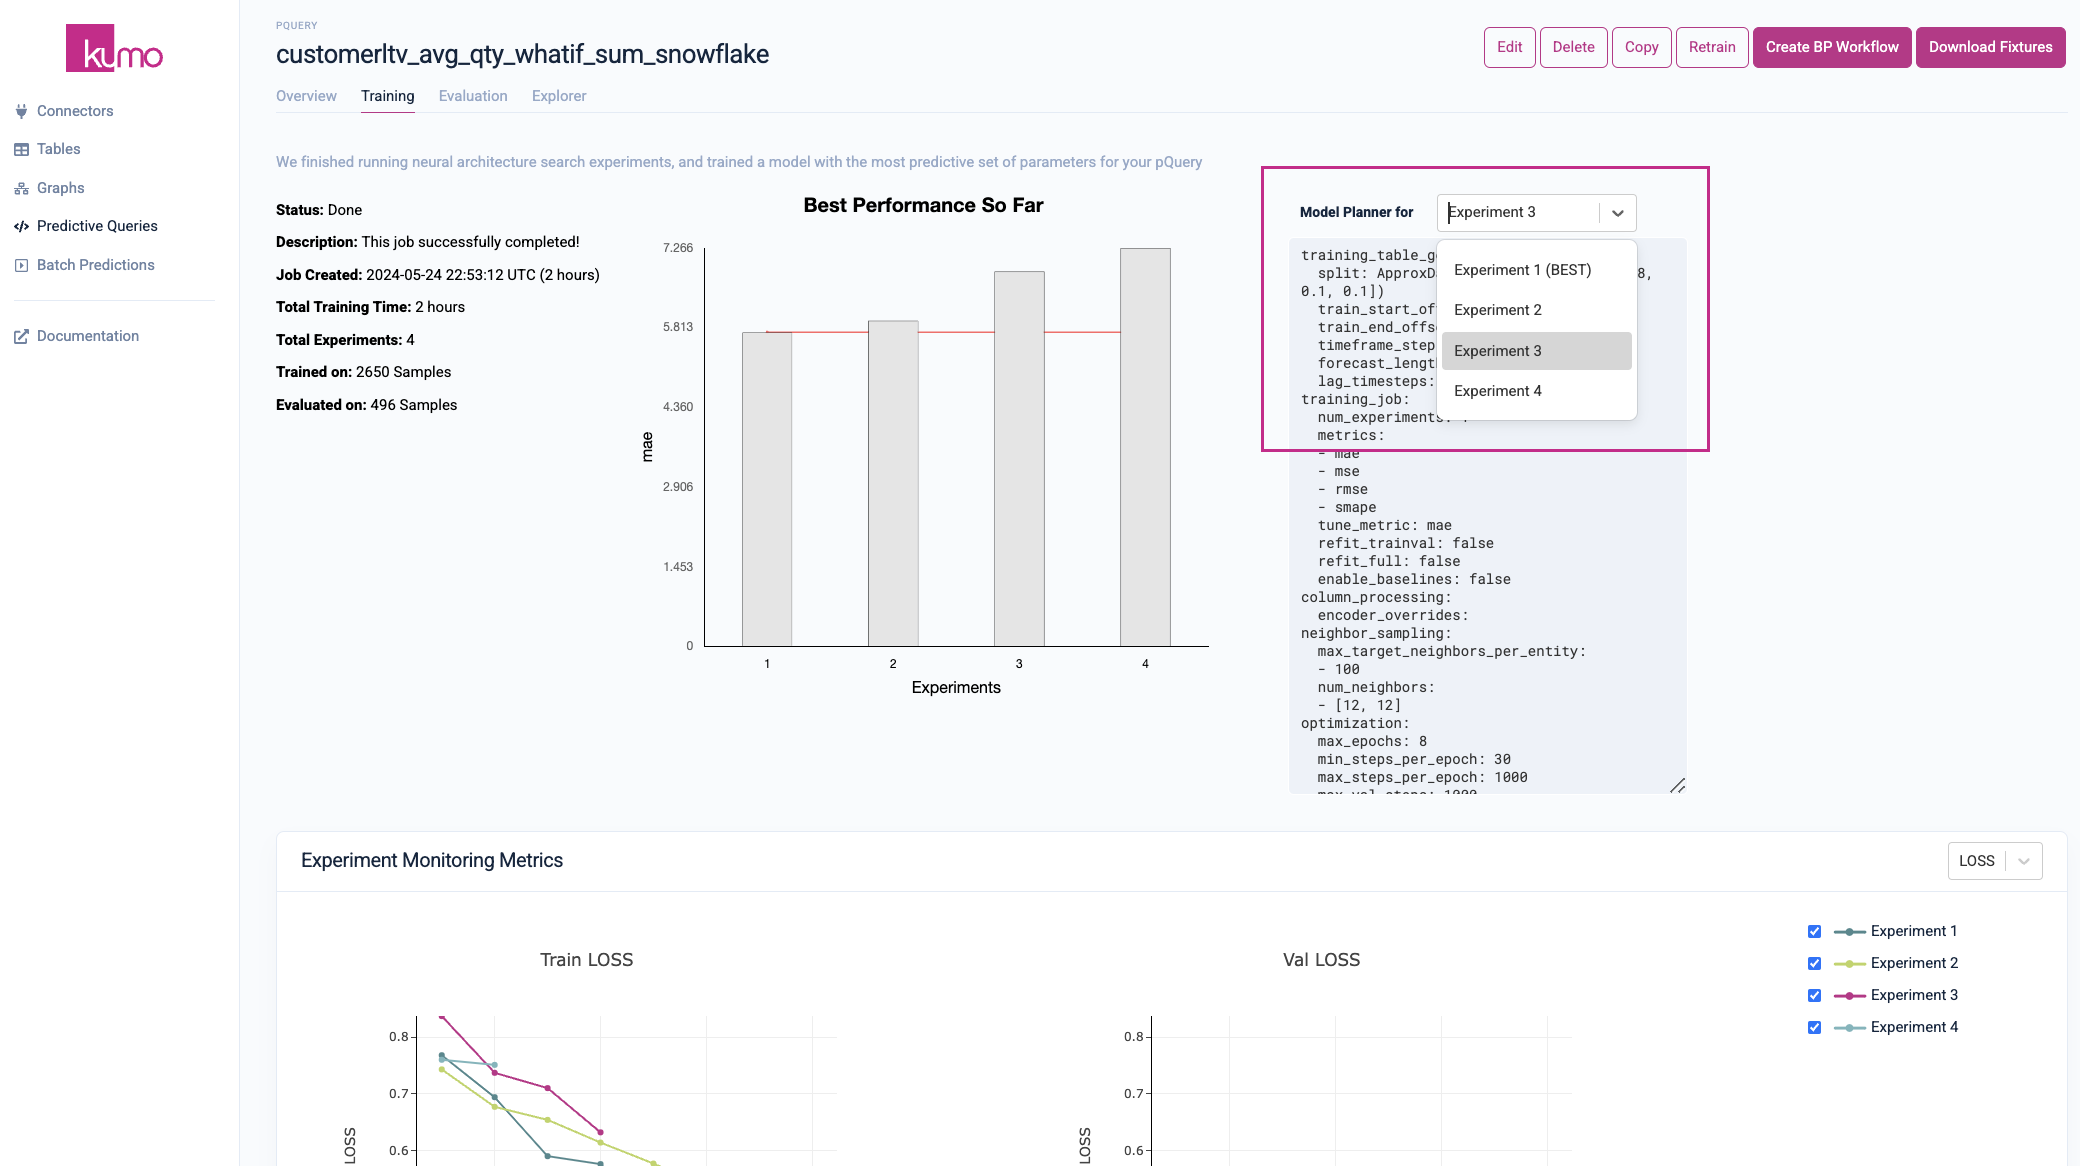
Kumo provides a full suite of tools and metrics for understanding how your training results are generated. To access a predictive query's experiment monitoring metrics, click on the Training tab from an existing pQuery's detail page to view the results of the neural architecture search experiments.
To enable comprehensive visibility into your model training results, statistics for the best performing experiment are displayed alongside the other experiments. You can also view your model planner configurations and settings per experiment by selecting a particular experiment from the drop-down list.
Experiment Monitoring Metrics
During the training process, Kumo automatically defines a search space of potential graph neural network (GNN) model architectures and hyperparameters, followed by an intelligent selection of a subset of specific architecture and hyperparameter configurations to run experiments with.
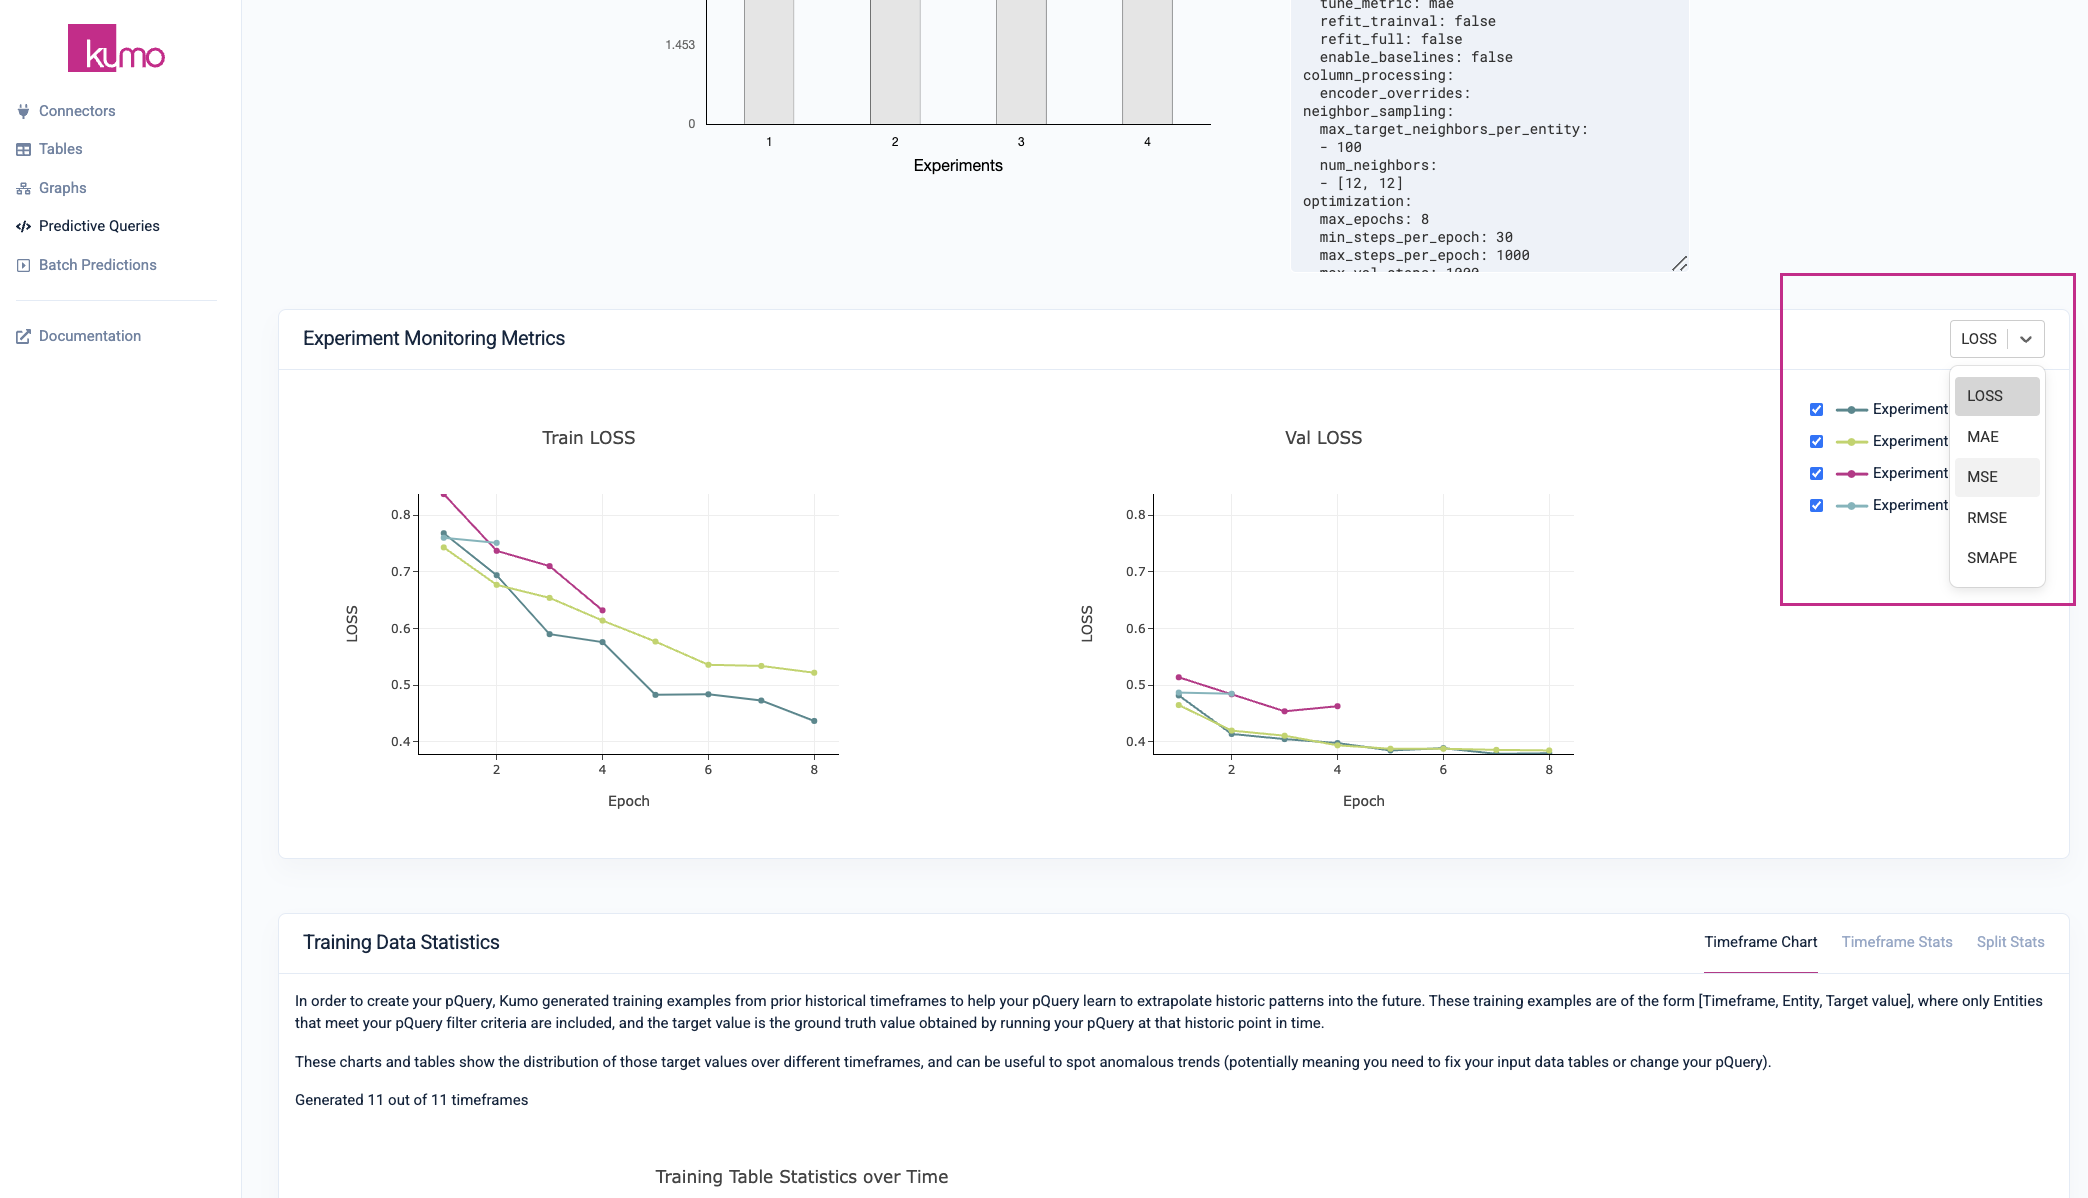
The single winning experiment (i.e., the winning model architecture and hyperparameter configuration on the validation data split) is then fully evaluated on the holdout data split—the results of this experiment are used to create your predictive query's evaluation metrics.
Note: predictive query training sessions in progress may not display all experiment monitoring metrics.
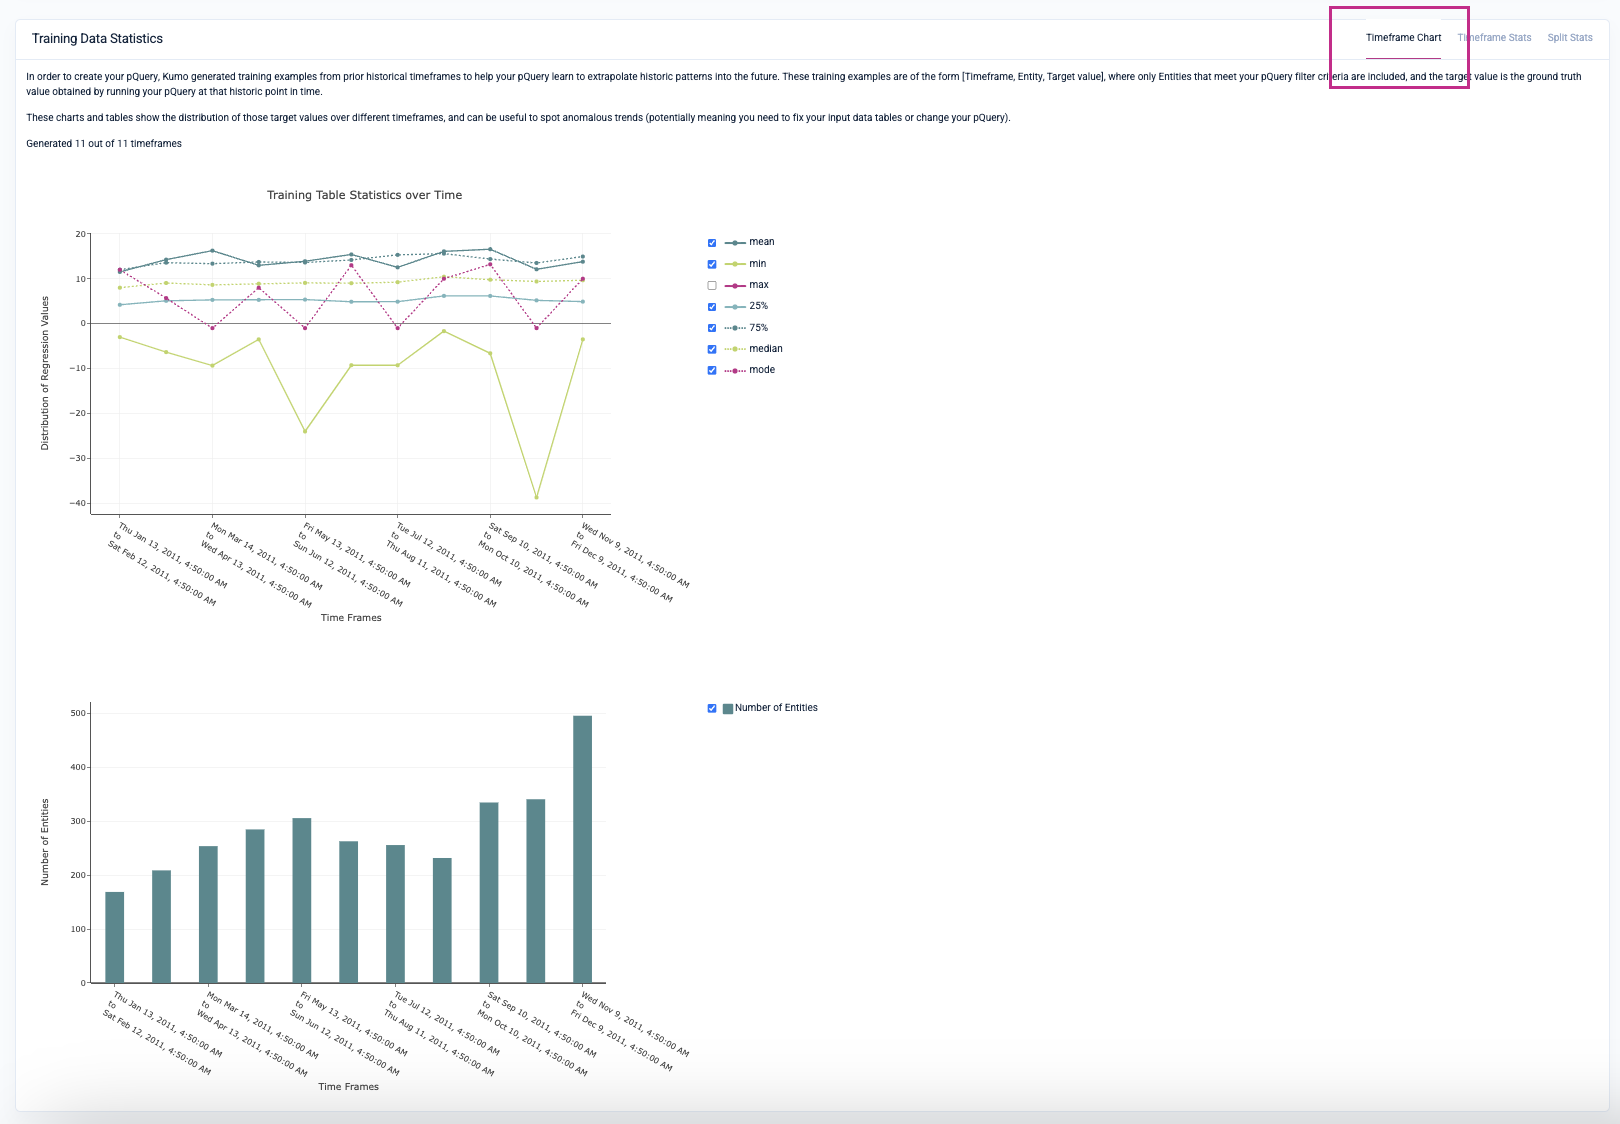
Training Data Statistics
The initial Timeframe Chart tab displays statistics for each timeframe as they are created, allowing you to properly assess the fitness of the training example distributions. The chart depicts the start and end time of each timeframe and the number of entities in that timeframe. These metrics will vary per your prediction type.
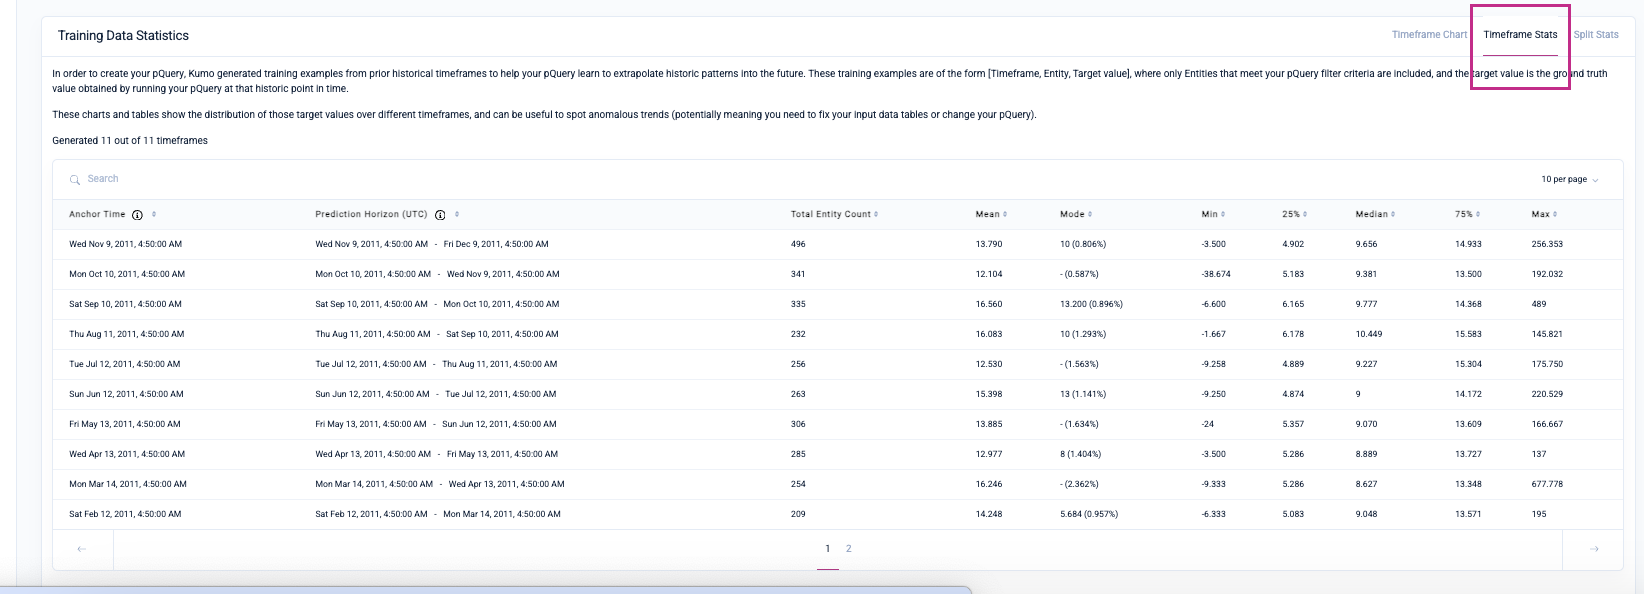
Under the Timeframe Stats tab, you can view statistics for each timeframe, including metrics indicating the spread of the set of target column values.
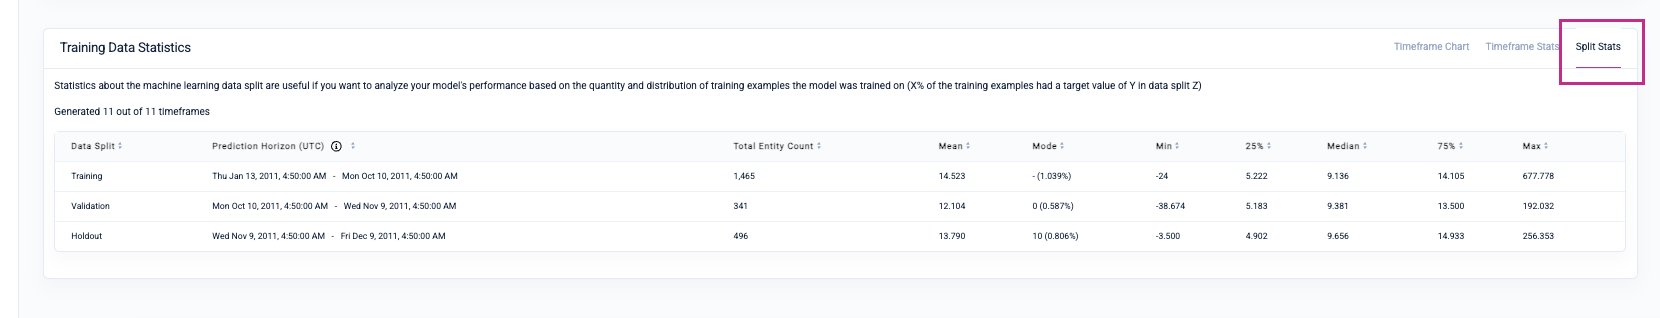
Under the Split Stats tab, Kumo provides statistics for the training, validation and holdout data splits for you to evaluate the quality and distribution of your training examples.
Please refer to the pQuery Reference Guide for more information about the pQuery language.
Updated 2 months ago