Explorer
The Explorer tab on the predictive query detail page provides insights into individual entity-level predictions and their subgraphs for a selected subset of entities. In particular:
- Entity-level XAI lets you explore individual model predictions and compare it against ground-truth data. For example, a predictive query that involves a link prediction task will display a list of selectable entity categories for viewing and comparing predictions against historical and ground truth data in a three-way pane.
- Entity-level XAI shows the full subgraph that is used inside the model to derive a prediction. This can be tremendously useful for debugging purposes (e.g, to see whether the model sees the expected inputs).
- Entity-level XAI lets you observe column importance scores for individual nodes in the surrounding of an entity (e.g., importance scores of transaction dates, article categories, etc.). Column importance scores are generated through backpropagation of gradients with regards to input columns. The higher the score, the more important this particular row/column pair is for your prediction.
- Entities to inspect are pre-selected based on a set of different criteria (e.g., true positives, true negatives, false positives, false negatives, cold start entities, etc.). This allows you easily explore a diverse and rich set of entities, across a wide range of different model predictions.
Entity Selection
Explorable entities are pre-selected and grouped into sets of different categories. For each category, 50 individual entities can be explored. Categories lets you explore different cohorts of entities (e.g., entities where the model makes the correct prediction with high confidence, entities where the model makes the wrong prediction with high confidence, entities for which the model is unsure about, cold start entities, etc.) This allows you easily explore a diverse and rich set of entities across a wide range of different model predictions. For each entity, the corresponding anchor time is displayed as well.
Model Prediction
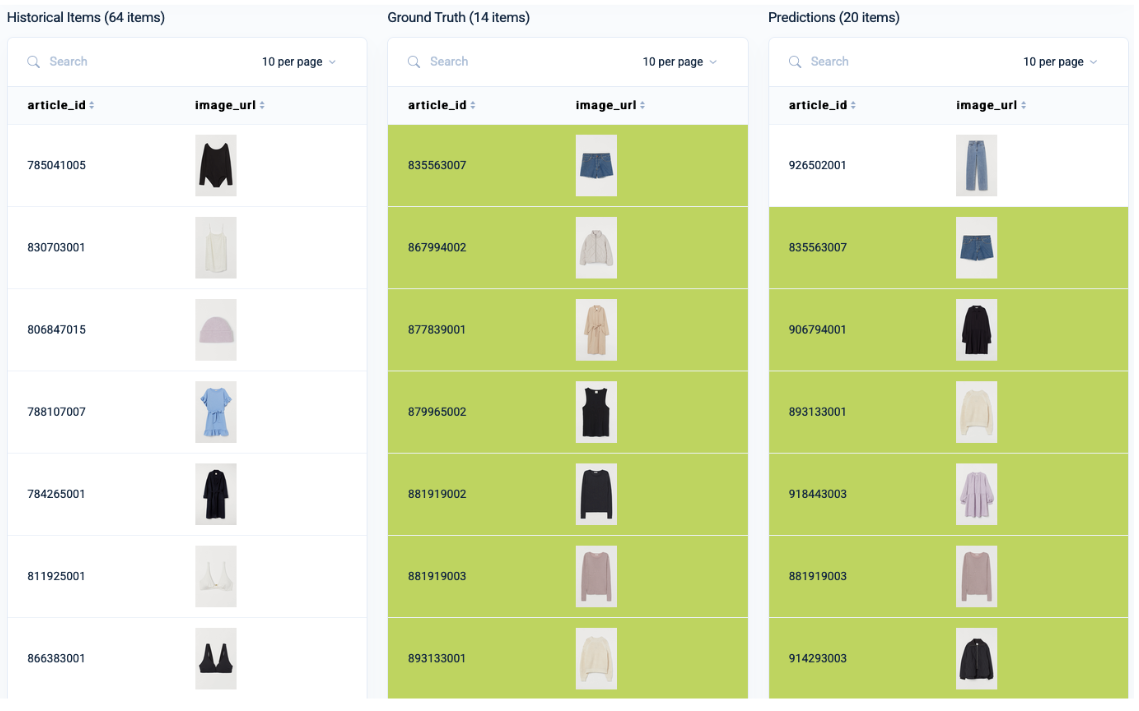
For a selected entity, Kumo shows the corresponding model prediction and ground-truth value. For link prediction tasks, Kumo shows the respective prediction in three searchable panes: Historical Items, Ground Truth, and Predictions. This three-way panes allow you to qualitatively assess model performance by comparing historical items with corresponding ground-truth and predicted items.
Above the pane, you can select the columns to compare against in the three-way pane. Panes include support for images, with items colored in green when the prediction matches with the ground truth label.
Subgraph Explorer
The subgraph explorer allows you to inspect the subgraph that was used as input to the model in order to make a prediction. This feature is highly useful for debugging purposes (e.g, to see whether the model sees the expected inputs).
Starting from the entity’s input row, the subgraph is visualized in a nested table layout that allows you to explore information it receives from different tables, following the respective foreign keys that point to this particular table. The traversal depth for connected items depends on the number of layers set in the model planner. Connected fact items are ordered by recency. If you cannot find a particular table here that you would expect to see, the table most likely unreachable within the given upper bound defined in the model planner.
The importance score not only helps you detect potential target leakage in your data, but also provides insights into your data and why a certain model prediction may be correct or wrong.
For example, take a look at a simple predictive query for churn query using the H&M dataset:
PREDICT COUNT(transactions.*, 0, 90, days) = 0
FOR EACH customers.customer_id
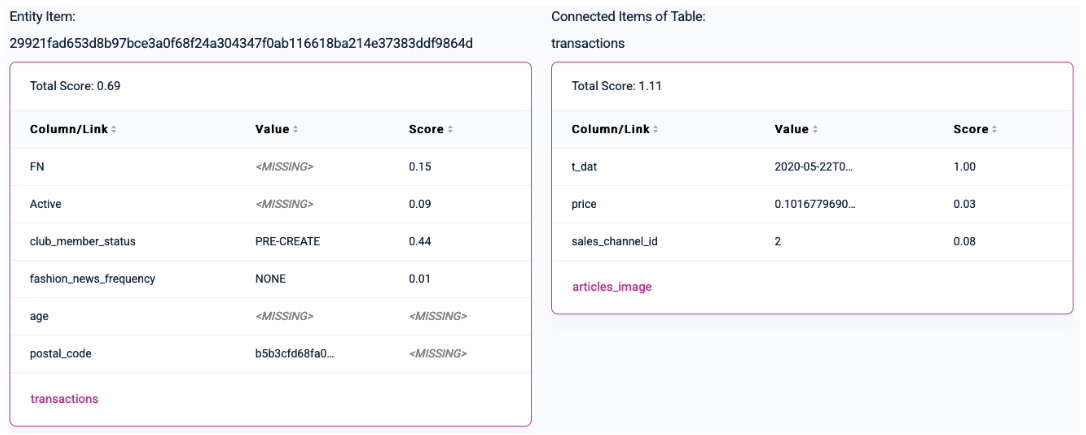
WHERE COUNT(transactions.*, -90, 0, days) > 0Consider one of the rare “false positive” entities (i.e, the model thinks the user will churn, but it actually will not)—by looking at the corresponding subgraph, you can see that the user has no active or club_member_status, and it does not receive fashion news. In addition, this user only has a single transaction in the past.
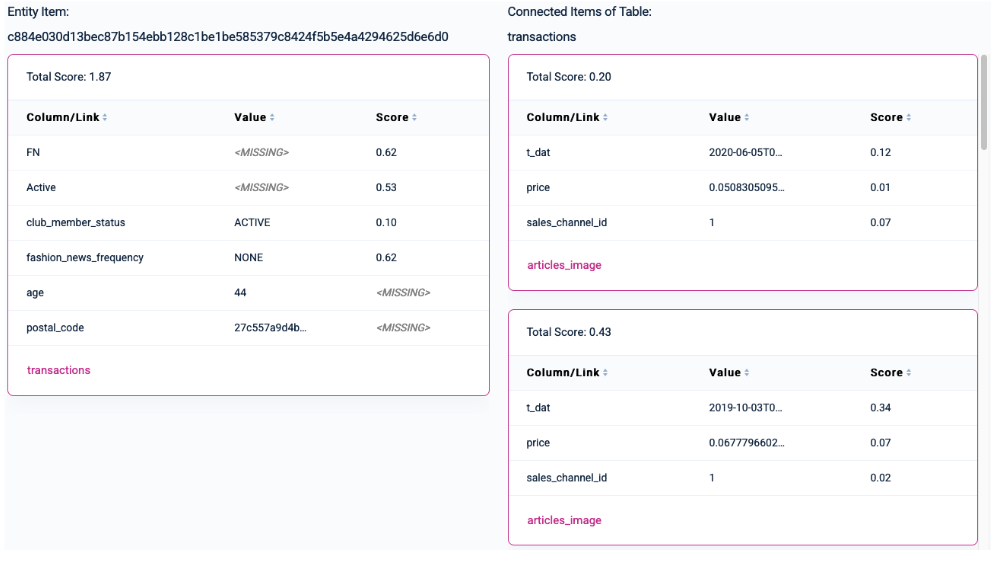
Another interesting category is the “Unsure” category (i.e., the model is unsure about whether a user will churn or not [probability ~0.5]). You can see, for example, that the user does not have an active status and does not receive fashion news, but has an active club member status. The user also has several past transactions, taking place in 6-7 month intervals. Considering these contradictory signals, the model signals that it is unsure about whether this particular user will churn or not, with a small tendency to churn:
Updated 2 months ago