Lead Scoring
Solution Background and Business Value
Companies invest substantial resources into marketing campaigns to gather leads for their sales teams. These campaigns can generate thousands or even tens of thousands of leads daily. To maximize the chances of converting these leads into sales, it is crucial for the sales team to engage with leads promptly after they engage with a marketing campaign. Sales teams need an effective method to rank and prioritize leads, as it is impractical to act on all of them. Currently, most marketing and sales teams rely on third-party scores that are not optimized for their specific business or clients, and do not utilize all internal business data for predictions. Consequently, these scores often perform no better than random predictions in forecasting conversion rates.
With a Kumo model, companies can leverage all their internal structured business data to generate truly optimized lead scores. These scores are specific to the business and are actually predictive of the propensity to convert.
Data Requirements and Kumo Graph
We can begin developing our model with a small set of core tables. Kumo allows us to extend the model by incorporating additional sources of signal.
Core tables
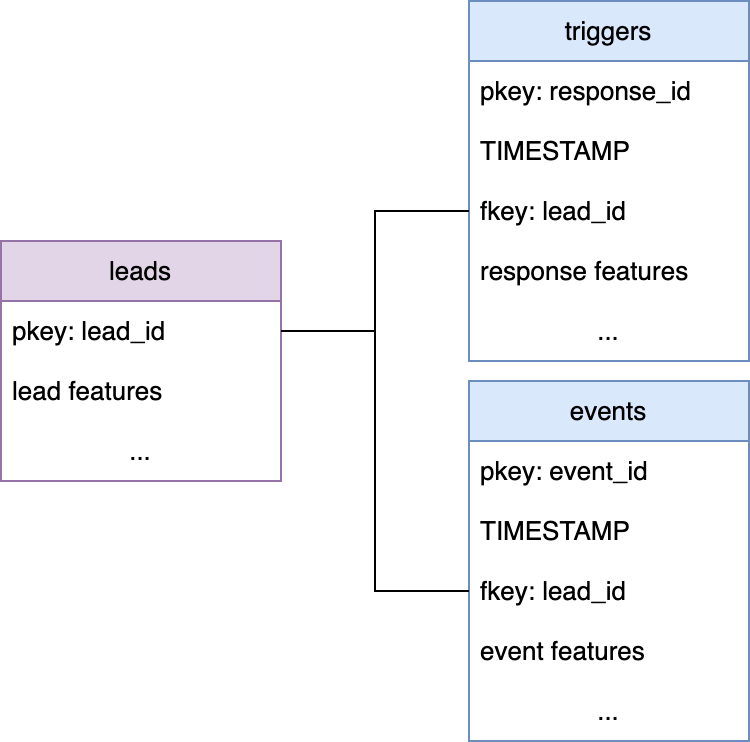
- Lead Table: This table holds information about all leads. It should include:
lead_id: A unique identifier for each lead.- Other attributes such as title, industry, location, etc.
- Trigger Table: This table records all marketing responses for leads, flagging our model to produce scores for them:
TIMESTAMP: The time of the response.lead_id: To link the responses to specific leads.- Other properties of the response.
- Event Table: This table records all interactions (including conversions) that the lead has had with the company across different channels and systems:
TIMESTAMP: The time of the event.lead_id: To link the events to specific leads.- Other properties of the event.
Additional table suggestions
There are many other tables which can optionally be included, such as:
- Additional Event Tables: From web logs, marketing tools, communication tools, etc.
- Organizations Table: Attributes of companies in case the lead can be tied to an organization.
- And many more possibilities.
Predictive Query
To effectively prioritize leads, we need to predict the likelihood that a lead who recently responded to a marketing campaign will convert in the next N days. This involves training a model that uses all relevant interactions and triggers.
Lead Conversion Prediction
This model predicts the likelihood that a lead who recently responded to a marketing campaign will convert in the next N days but only train using those leads that the sales team had time to reach out to, this way the data is not biased by past sales team engagement.
PREDICT COUNT(events.* WHERE events.type = 'conversion', 0, N, days ) > 0
FOR EACH leads.lead_id
WHERE COUNT(triggers.*,-1, 0, days) > 0
ASSUMING COUNT(events.* WHERE events.source = 'sales', 0, 1, days ) > 0
At prediction time this model scores all potential leads ASSUMING they will be reached out to by the sales team.
Deployment
In production, the model is used to score leads in a batch fashion using the latest data available to the business. These scores are then stored by Kumo in the data warehouse for use by downstream systems like Salesforce. This enables the sales team to utilize the lead ranking scores when deciding how to allocate their limited time, thereby increasing conversions.
Updated 2 months ago