Row Level Explainability
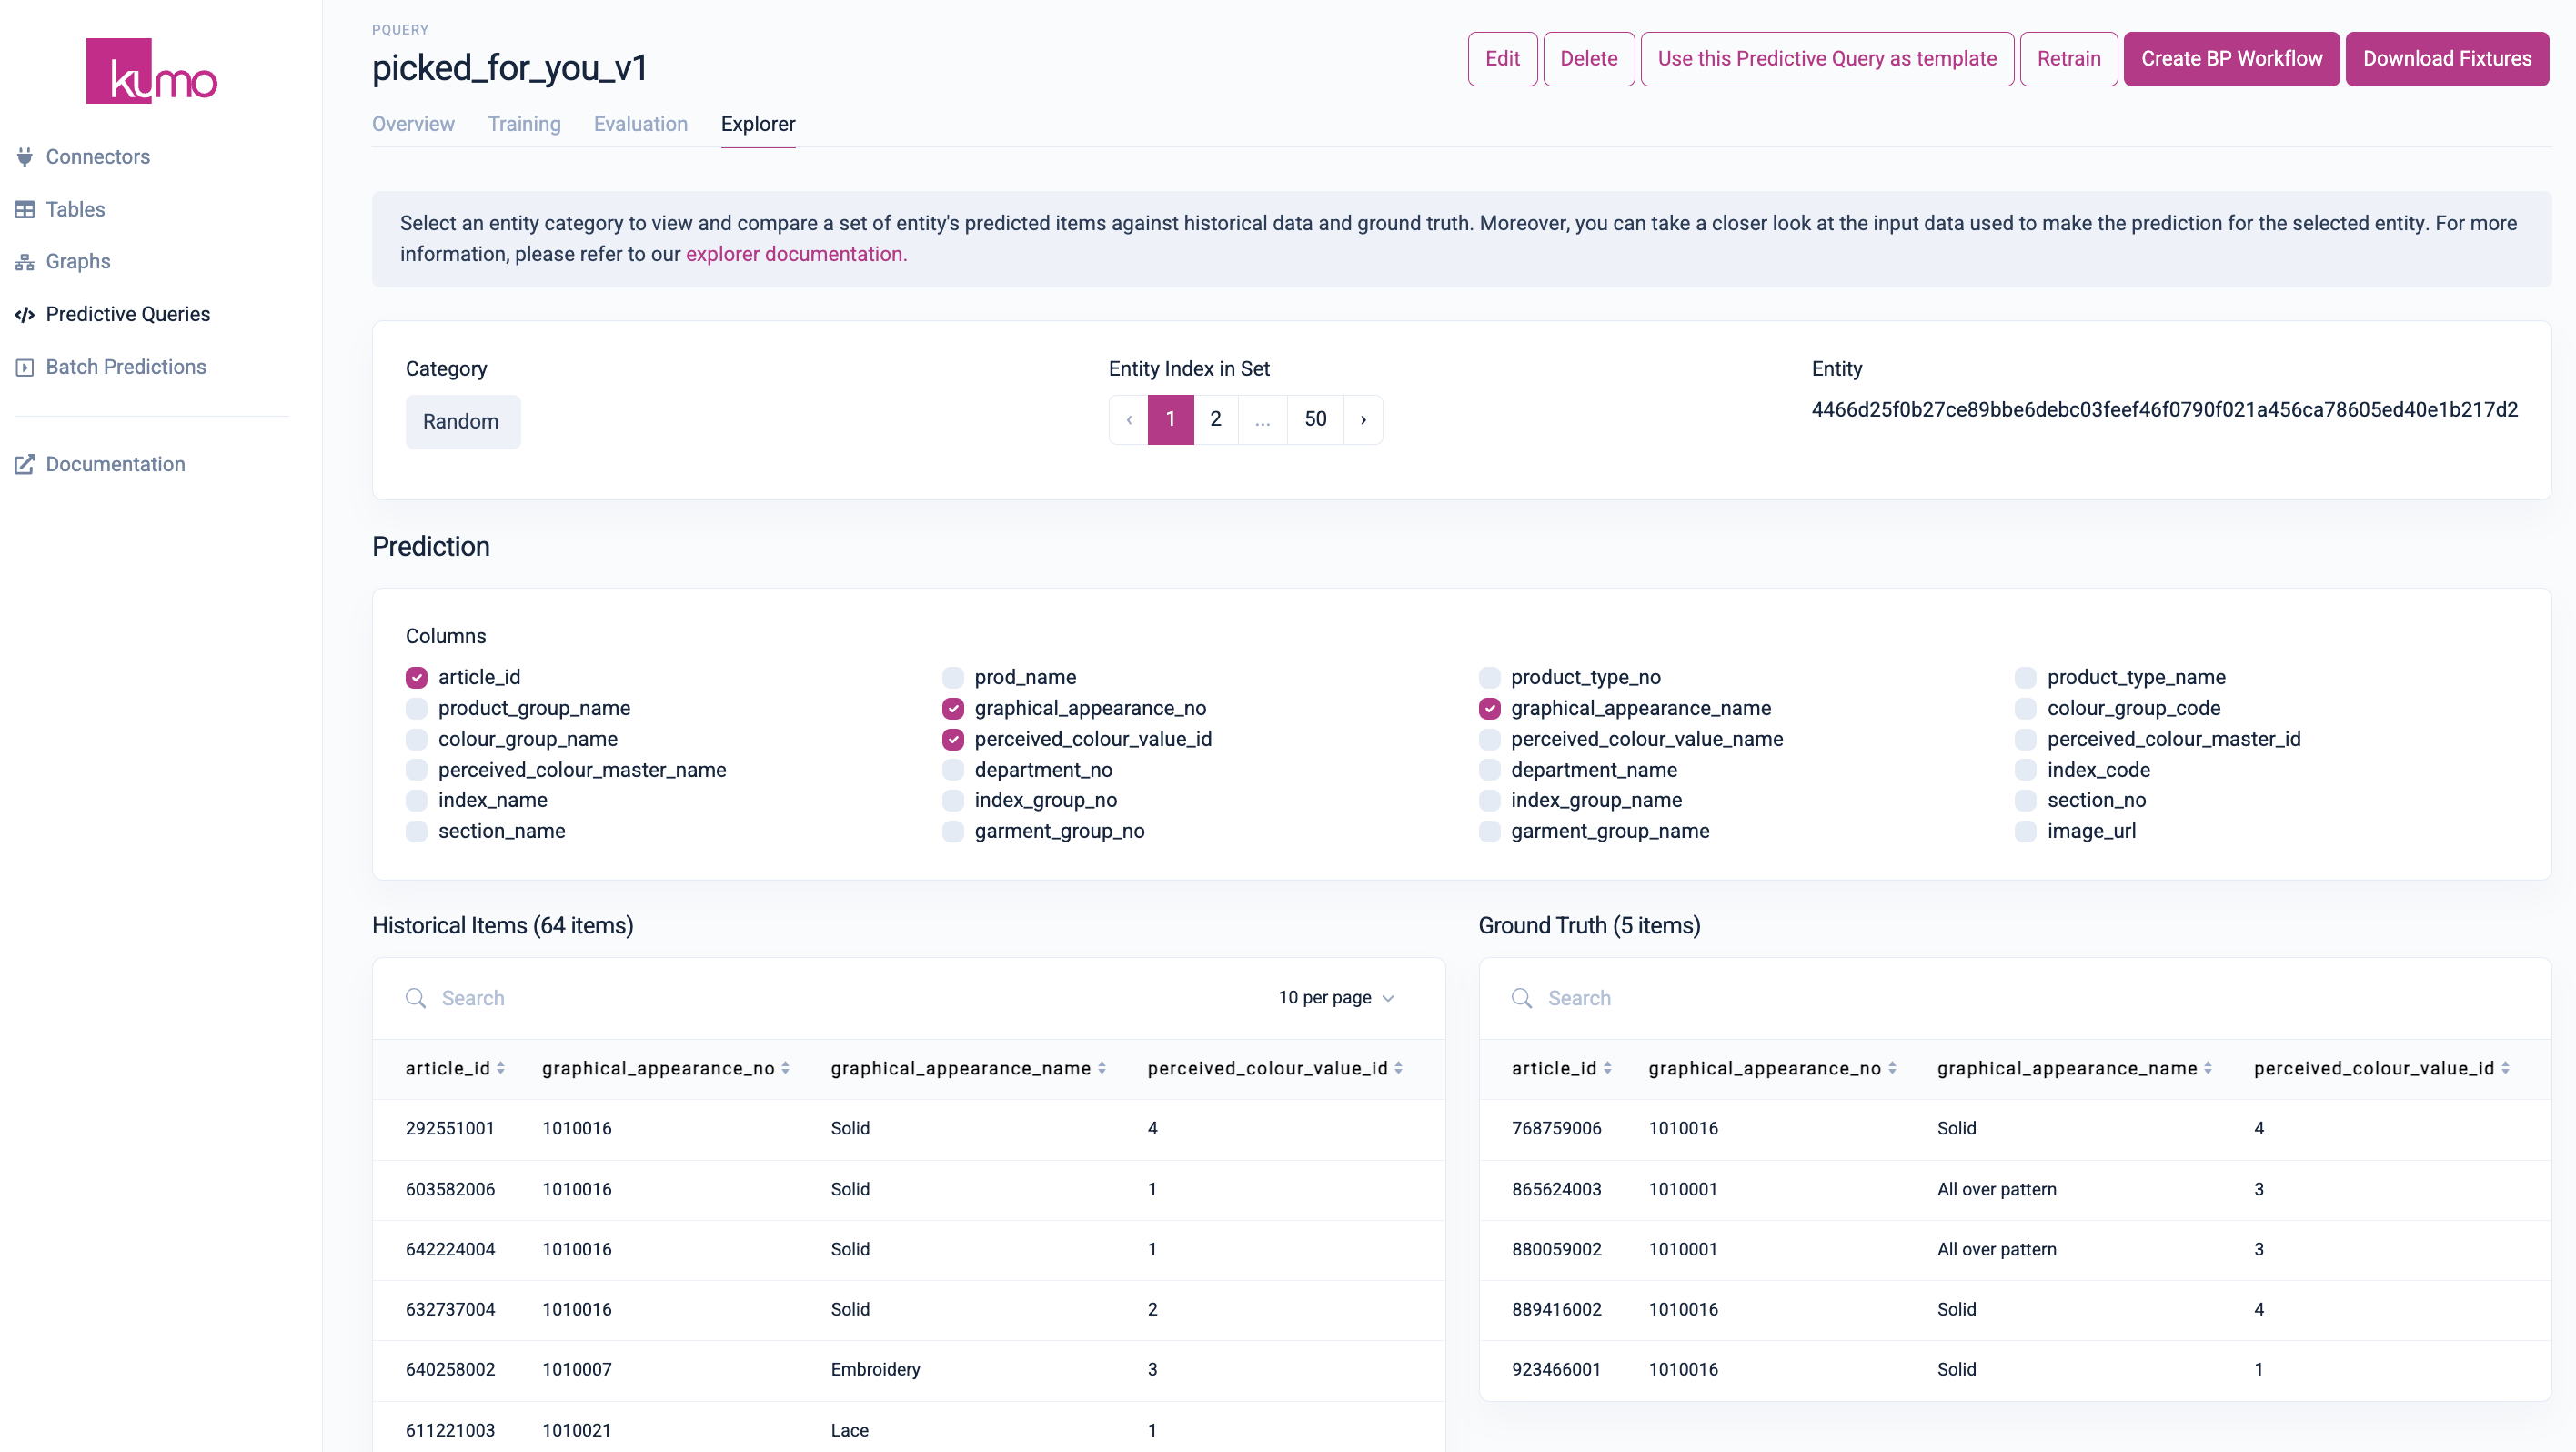
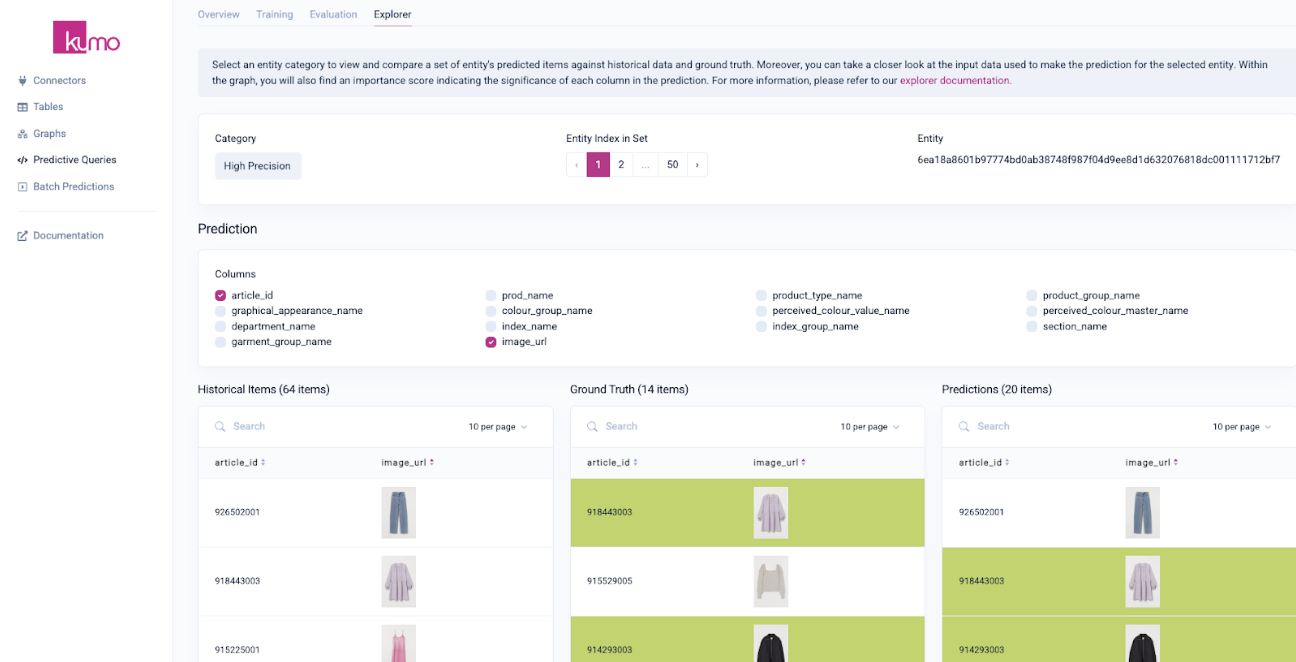
Under the Explorer tab, you can navigate through the input graph used for the prediction of a specific item, while seeing the importance of each feature in the input graph. The input graph contains the following:
- the attributes of a specific item (e.g., users member_status, age, postcode)
- all connected items, subsequent connected items, and their attributes
The traversal depth for connected items is dependent on the number of layers set in the model planner, and items are pre-selected based on a set of varying criteria (e.g., true positives, true negatives, false positives, false negatives, cold start entities, etc.) This lets you easily explore a diverse and rich set of entities across a wide range of different model predictions.
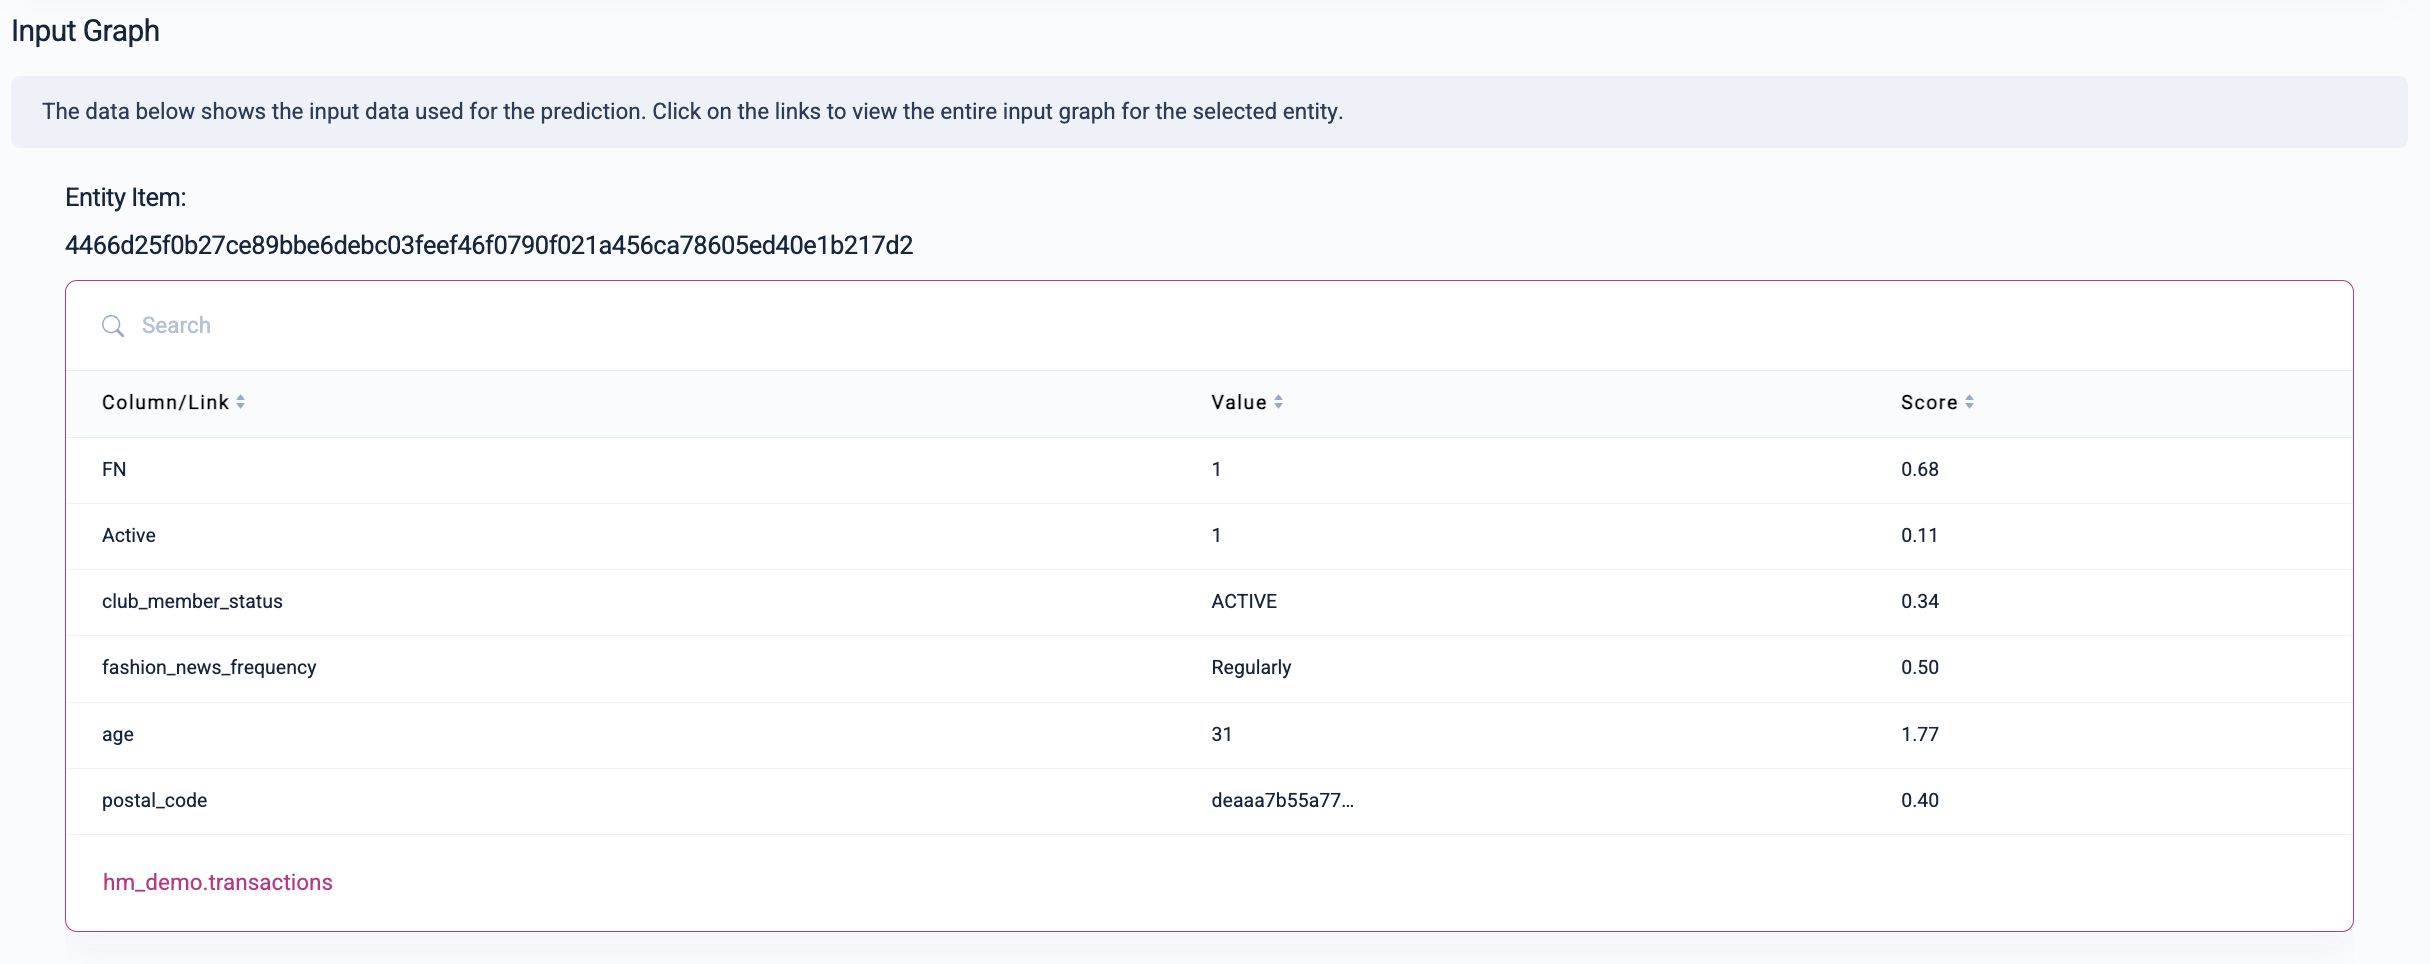
In addition to the item values, each table contains a "Score" that allows you to observe column importance scores for individual nodes in the surrounding of an entity (e.g., importance scores of transaction dates, article categories, etc.).
Score values are generated through backpropagation of gradients with regards to input columns, and indicate the feature's importance to the particular prediction—the higher the score, the more important this particular row/column pair is for your prediction.
Updated 2 months ago